UReader
Brands
Sign in
Sign up
Newsletter Search Engine
Dates
2025 (205704)
2026 (56627)
2024 (51094)
Business Categories
General
(99708)
Other
(57033)
Home
(21824)
Fashion
(20866)
Electronics
(16522)
Literature
(11163)
Sports
(11025)
Art
(8467)
Machinery
(4992)
Health
(4649)
Food
(2899)
Country
GLOBAL
(36079)
CO
(19570)
NL
(17160)
AU
(16671)
GB
(14791)
NZ
(14717)
US
(13487)
BE
(13119)
DE
(8873)
FI
(8534)
CL
(7627)
CA
(7423)
PL
(7278)
RO
(7115)
ES
(6735)
HU
(6458)
ZA
(6393)
IL
(5943)
AR
(5908)
DK
(5620)
FR
(5269)
SK
(5202)
BR
(5140)
HR
(5049)
IT
(4967)
CZ
(4633)
PT
(4472)
SE
(4440)
IE
(3820)
GR
(3804)
NO
(3763)
SG
(3120)
CH
(3038)
BG
(2902)
RU
(2596)
MY
(2266)
UA
(2238)
MX
(2144)
JP
(2114)
AT
(2114)
PE
(1842)
RS
(1753)
TR
(753)
VE
(747)
IO
(665)
ID
(589)
TW
(584)
PK
(574)
IQ
(539)
HK
(497)
MA
(476)
PH
(434)
TV
(407)
AE
(315)
TH
(247)
KW
(188)
KP
(108)
VN
(54)
EG
(42)
IN
(8)
KZ
(4)
MD
(2)
NU
(2)
LT
(1)
BA
(1)
LK
(1)
Total 313425 mails
mytopia
AU
·
2026-6-9
⚡ Blink & You’ll Miss It 🧨
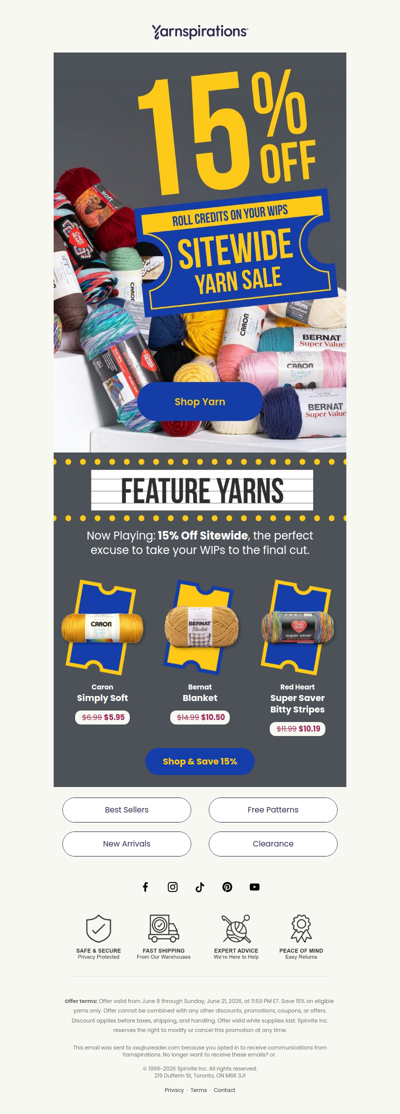
yarnspirations
GLOBAL
·
2026-6-9
👀 Deals on Go-To Yarns
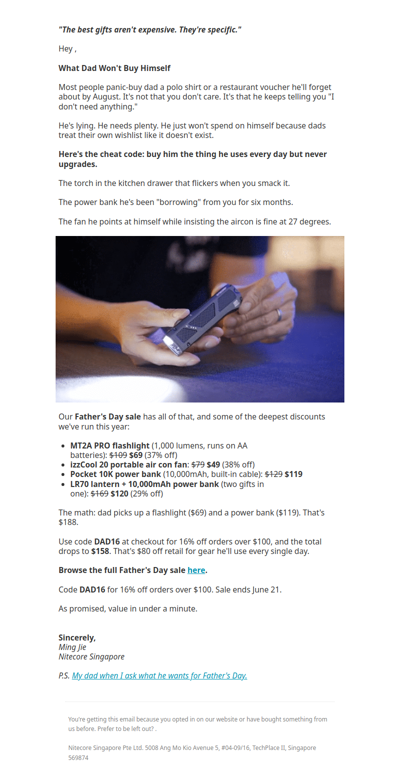
nitecorelights
SG
·
2026-6-9
Gear Drop: What Dad Won't Buy Himself
smartbuyglasses
ZA
·
2026-6-9
He's going to love these
flowerstore
PH
·
2026-6-9
The ube gifts everyone's been waiting for 💜
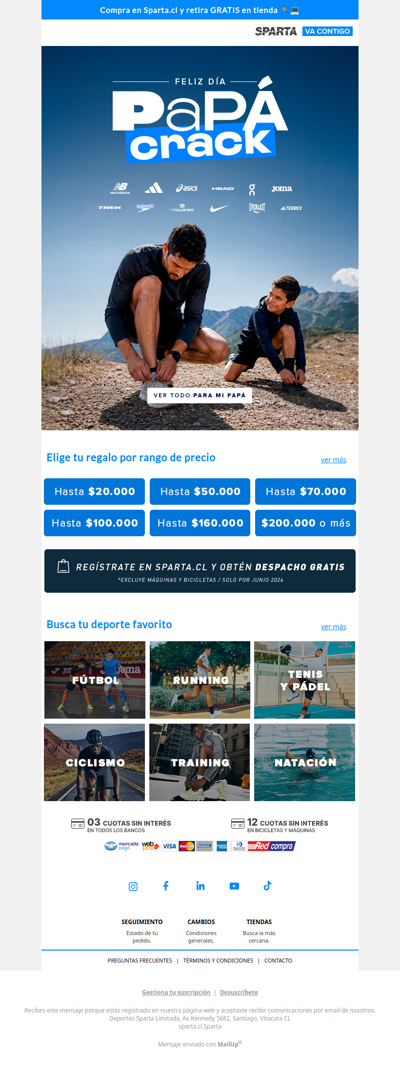
sparta
CL
·
2026-6-9
Encuentra el regalo para tu papá crack 😍
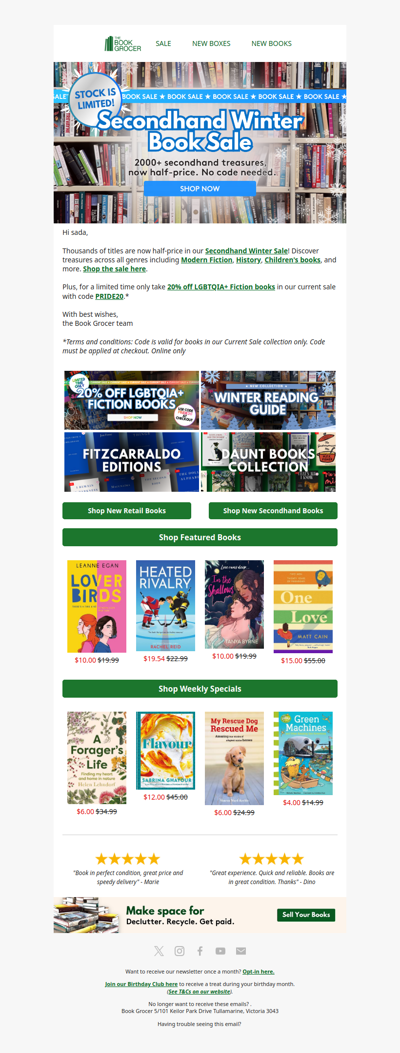
bookgrocer
AU
·
2026-6-9
Massive Secondhand Winter Sale on now🤩📚
itvsn
AU
·
2026-6-9
Stock up & Save with our Beauty Award Value Packs
westelm
GLOBAL
·
2026-6-9
Our favorite small space sofas
tvsn
NZ
·
2026-6-9
Stock up & Save with our Beauty Award Value Packs
lifeisgood
US
·
2026-6-9
Pool Parties. Barbecues. T-Shirts.
toypanic
MY
·
2026-6-9
ToyPanic Preorder & In-Stock - 09/06/2026
1
2
3
4
5
©2024 UReader
Home
Brands
Marked Emails
Followed Brands
Privacy Policy & User Agreement