Newsletter Search Engine
Total 314634 mails
looksharpstore
NZ
·
2026-6-12
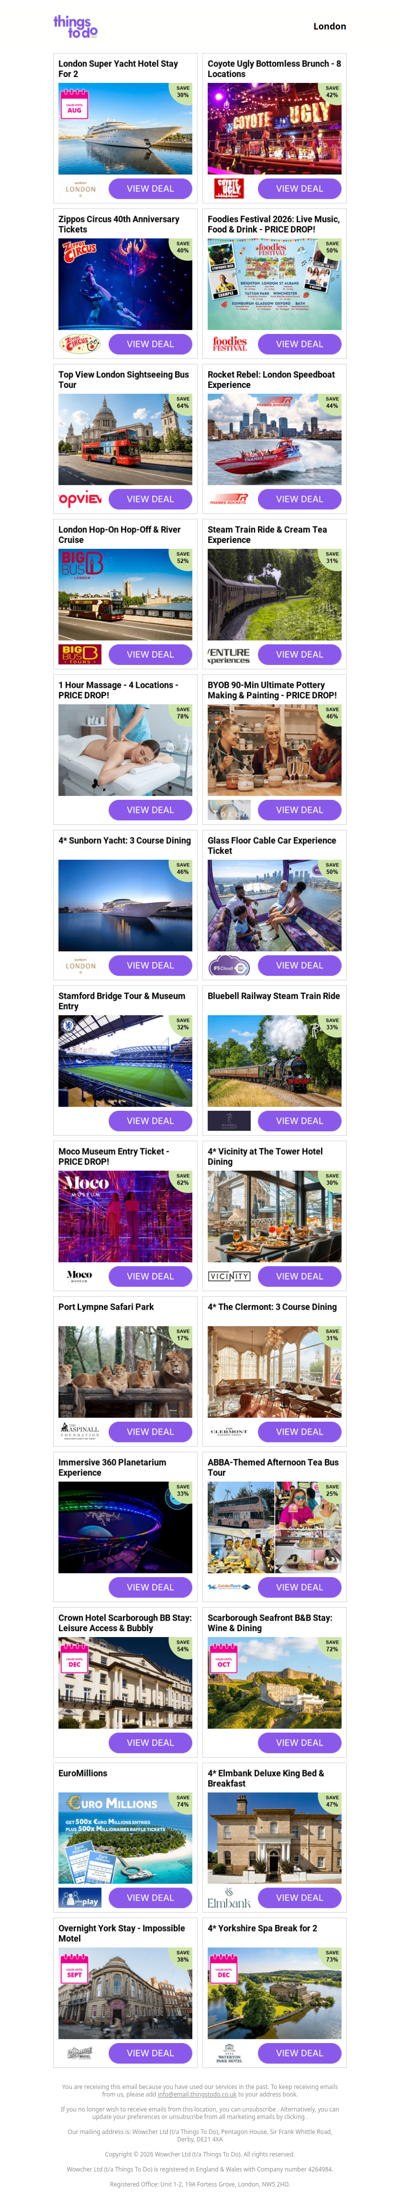
London Super Yacht Hotel Stay For 2 | Coyote Ugly Bottomless Brunch - 8 Locations | Zippos Circus 40th Anniversary Tickets | Foodies Festival 2026: Live Music, Food & Drink - PRICE DROP! | Top View London Sightseeing Bus Tour
livingsocial
GB
·
2026-6-12
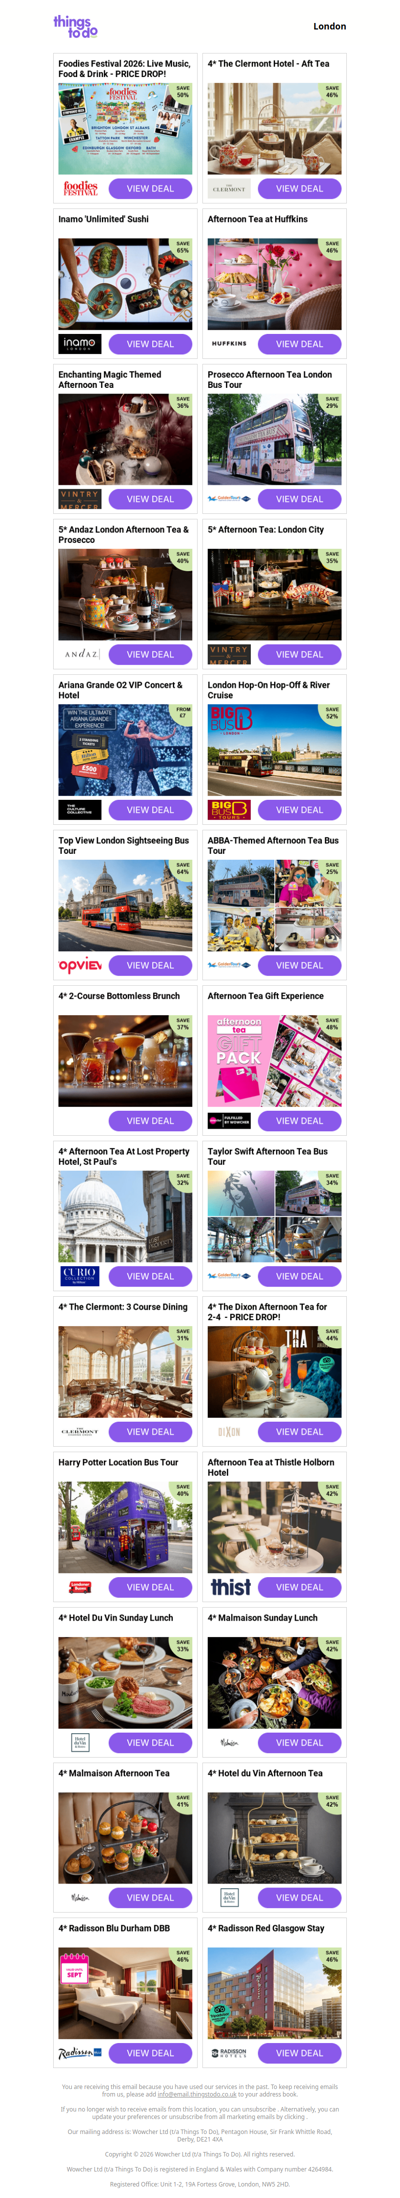
Foodies Festival 2026: Live Music, Food & Drink - PRICE DROP! | 4* The Clermont Hotel - Aft Tea | Inamo 'Unlimited' Sushi | Afternoon Tea at Huffkins | Enchanting Magic Themed Afternoon Tea
ponudadana
HR
·
2026-6-12
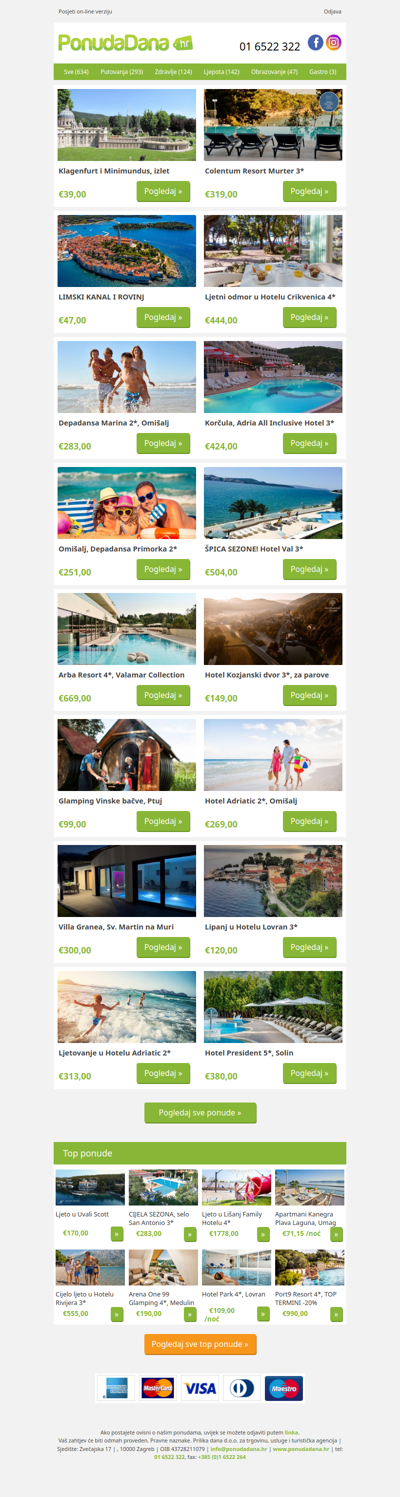
✔ Klagenfurt i Minimundus, izlet | Colentum Resort Murter 3 | LIMSKI KANAL I ROVINJ | Ljetni odmor u Hotelu Crikvenica 4 | Depadansa Marina 2, Omišalj | Korčula, Adria All Inclusive Hotel 3 | Omišalj, Depadansa Primorka 2