UReader
Brands
Sign in
Sign up
Newsletter Search Engine
Dates
2025 (205704)
2026 (59686)
2024 (51094)
Business Categories
General
(100596)
Other
(57497)
Home
(22072)
Fashion
(21103)
Electronics
(16688)
Literature
(11243)
Sports
(11163)
Art
(8566)
Machinery
(5018)
Health
(4671)
Food
(2931)
Country
GLOBAL
(36528)
CO
(19590)
NL
(17285)
AU
(16901)
GB
(14932)
NZ
(14901)
US
(13618)
BE
(13202)
DE
(8943)
FI
(8632)
CL
(7703)
CA
(7486)
PL
(7341)
RO
(7167)
ES
(6770)
HU
(6533)
ZA
(6468)
AR
(6029)
IL
(5977)
DK
(5660)
FR
(5332)
SK
(5245)
BR
(5189)
HR
(5101)
IT
(4994)
CZ
(4669)
PT
(4505)
SE
(4494)
IE
(3878)
GR
(3836)
NO
(3809)
SG
(3157)
CH
(3068)
BG
(2930)
RU
(2641)
MY
(2297)
UA
(2273)
MX
(2184)
AT
(2139)
JP
(2132)
PE
(1858)
RS
(1784)
TR
(759)
VE
(757)
IO
(673)
TW
(591)
ID
(590)
PK
(577)
IQ
(546)
HK
(499)
MA
(476)
PH
(442)
TV
(411)
AE
(319)
TH
(252)
KW
(188)
KP
(108)
VN
(54)
EG
(42)
IN
(8)
KZ
(4)
MD
(2)
NU
(2)
LT
(1)
BA
(1)
LK
(1)
Total 316484 mails
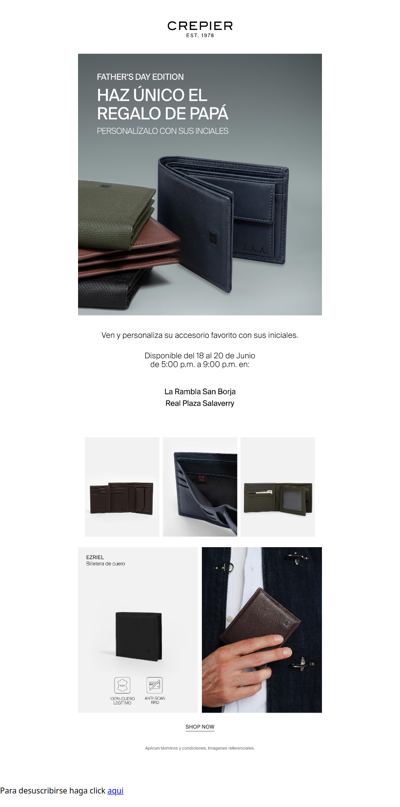
crepier
PE
·
2026-6-18
Haz único el regalo de papá
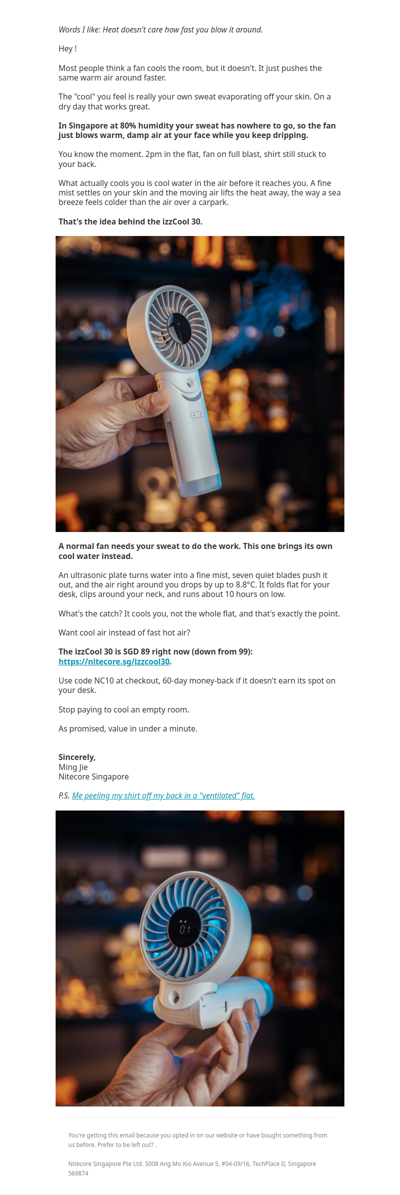
nitecorelights
SG
·
2026-6-18
Gear Drop: Your Fan Isn't Cooling You
westelm
GLOBAL
·
2026-6-18
Lighting upgrade
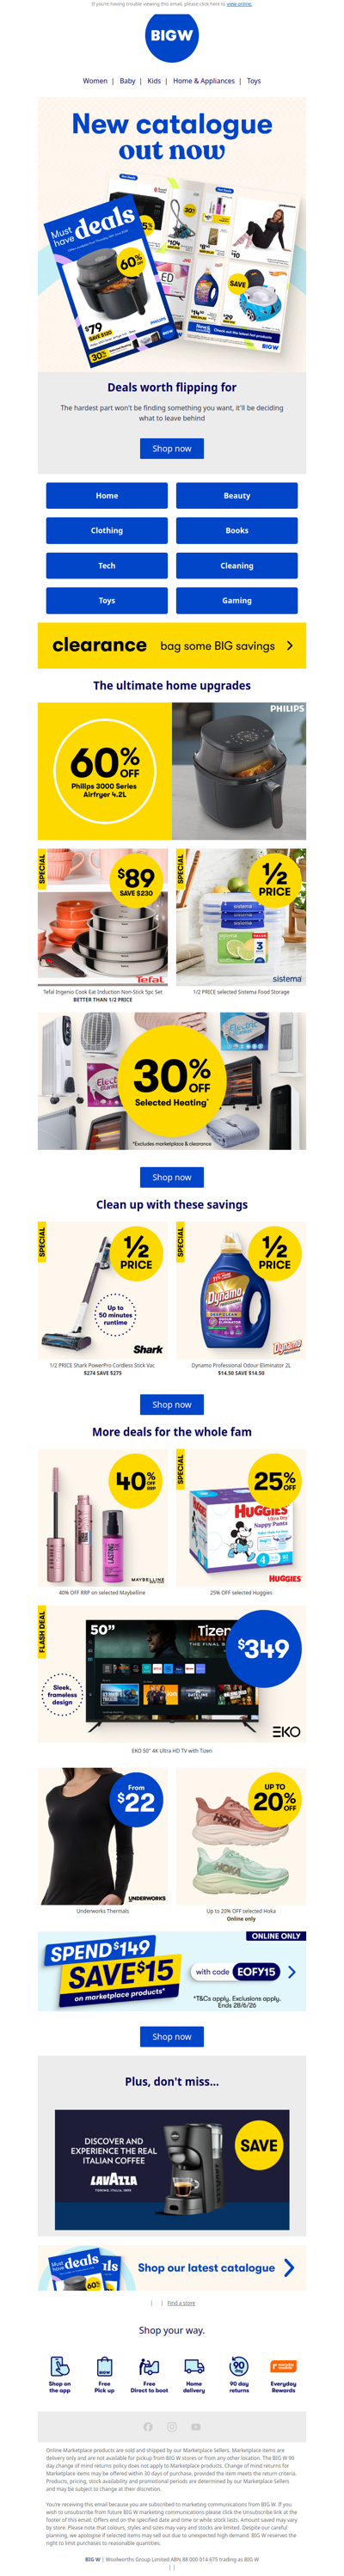
bigw
AU
·
2026-6-18
It's catalogue day 🙌
bellababy
IE
·
2026-6-18
Don't lose your items!
esh2u
MY
·
2026-6-18
👨🍳 Live Cooking Demo Every Friday & Saturday at ESH SS2
bellababy
IE
·
2026-6-18
Forget something?
smartbuyglasses
ZA
·
2026-6-18
Champion, New Balance, and Ann Taylor have landed
musicworld
CL
·
2026-6-18
Para el papá que siempre tiene una canción para cada momento 🙌
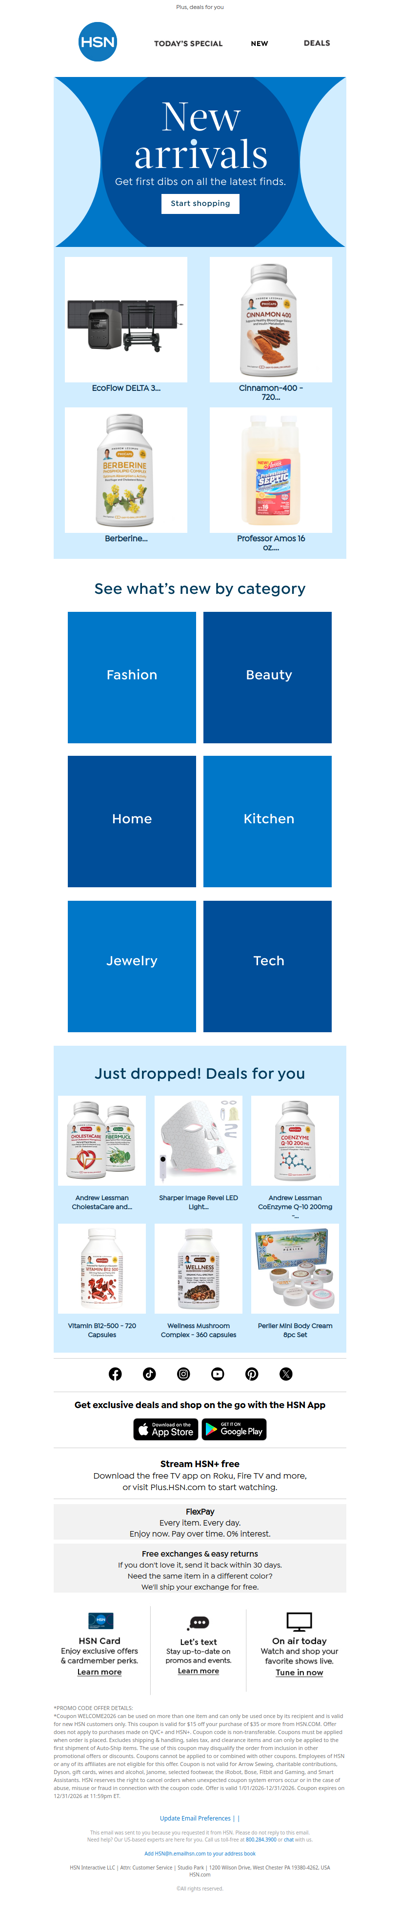
hsn
GLOBAL
·
2026-6-18
Look What's New: EcoFlow & More!
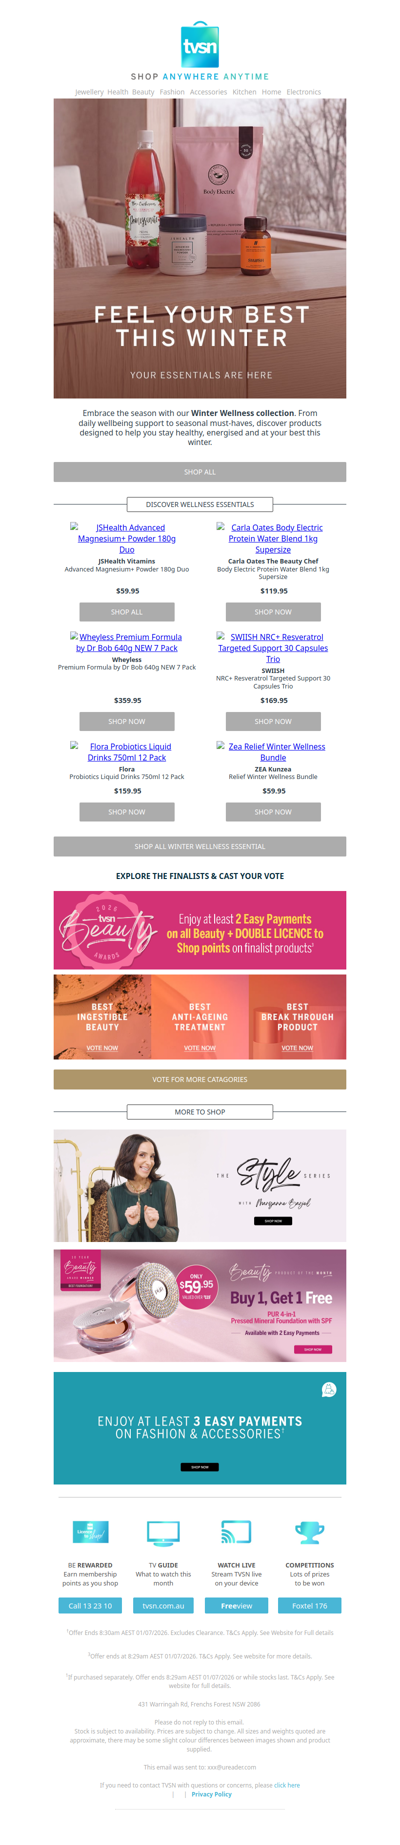
tvsn
NZ
·
2026-6-18
Feel Your Best This Winter With These Essentials
itvsn
AU
·
2026-6-18
Feel Your Best This Winter With These Essentials
1
2
3
4
5
©2024 UReader
Home
Brands
Marked Emails
Followed Brands
Privacy Policy & User Agreement