UReader
Brands
Sign in
Sign up
Newsletter Search Engine
Dates
2025 (205704)
2026 (59331)
2024 (51094)
Business Categories
General
(100492)
Other
(57443)
Home
(22041)
Fashion
(21076)
Electronics
(16670)
Literature
(11234)
Sports
(11148)
Art
(8554)
Machinery
(5015)
Health
(4666)
Food
(2929)
Country
GLOBAL
(36476)
CO
(19588)
NL
(17272)
AU
(16870)
GB
(14917)
NZ
(14876)
US
(13607)
BE
(13191)
DE
(8937)
FI
(8622)
CL
(7696)
CA
(7478)
PL
(7332)
RO
(7159)
ES
(6762)
HU
(6526)
ZA
(6458)
AR
(6015)
IL
(5972)
DK
(5655)
FR
(5324)
SK
(5239)
BR
(5183)
HR
(5096)
IT
(4993)
CZ
(4666)
PT
(4500)
SE
(4490)
IE
(3871)
GR
(3829)
NO
(3804)
SG
(3156)
CH
(3064)
BG
(2926)
RU
(2635)
MY
(2295)
UA
(2271)
MX
(2180)
AT
(2135)
JP
(2129)
PE
(1854)
RS
(1781)
TR
(759)
VE
(756)
IO
(672)
TW
(591)
ID
(590)
PK
(577)
IQ
(545)
HK
(499)
MA
(476)
PH
(442)
TV
(410)
AE
(319)
TH
(252)
KW
(188)
KP
(108)
VN
(54)
EG
(42)
IN
(8)
KZ
(4)
MD
(2)
NU
(2)
LT
(1)
BA
(1)
LK
(1)
Total 316129 mails
fromjapan
JP
·
2026-6-17
【限时2天】乐天95折优惠中!日本限定商品一次GET! [FJ]
opticsplanet
GLOBAL
·
2026-6-17
📲 Check Us Out on Social!
outspot
DE
·
2026-6-17
2 sportliche, bequeme Herrenshorts
scammellauctions
AU
·
2026-6-17
Showcase Auction online and special announcement🤩
1sale
US
·
2026-6-17
🌠 The Best 10 Amazon Finds Come Out at Night
kogan
GLOBAL
·
2026-6-17
Awesome Dyson deals 💥 5% OFF with code inside!
italika
MX
·
2026-6-17
🖥️ Hasta 24 MSI en Scooters, Pantallas, Colchones y más 📲
meh
US
·
2026-6-17
Summer Break Meh-rathon!
costco
AU
·
2026-6-17
New Arrivals at Costco Online! ✨
canningvale
GLOBAL
·
2026-6-17
🤩 All Towels for the Price of a Face Washer
robinsons
SG
·
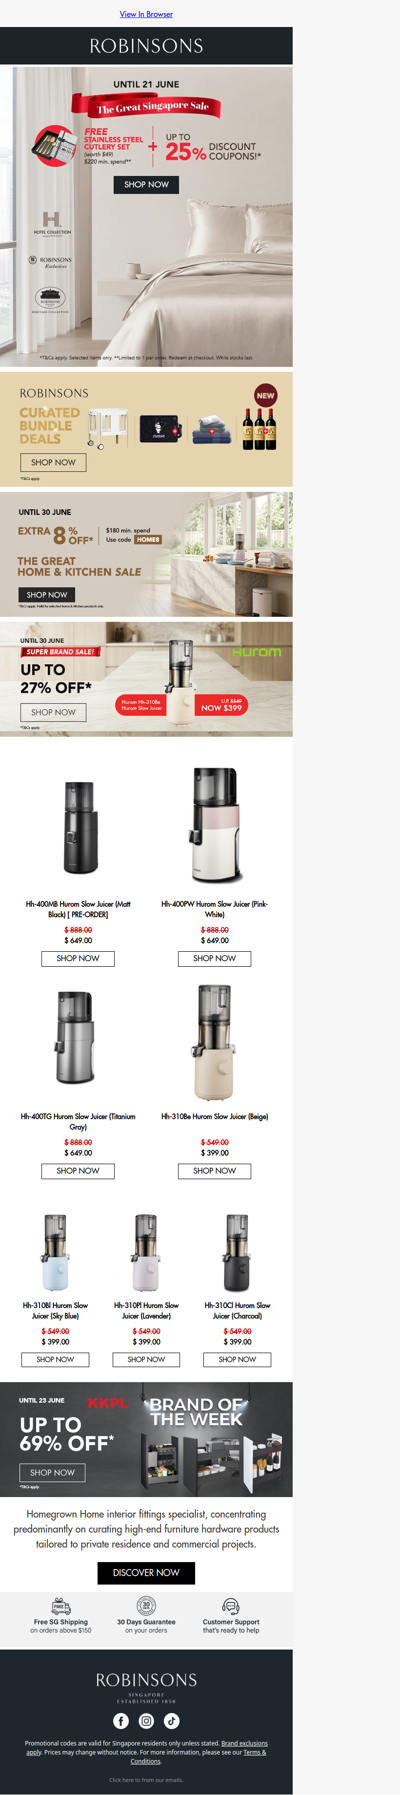
2026-6-17
Shop GSS Picks and Get a Free Cutlery Set
topcashback
AU
·
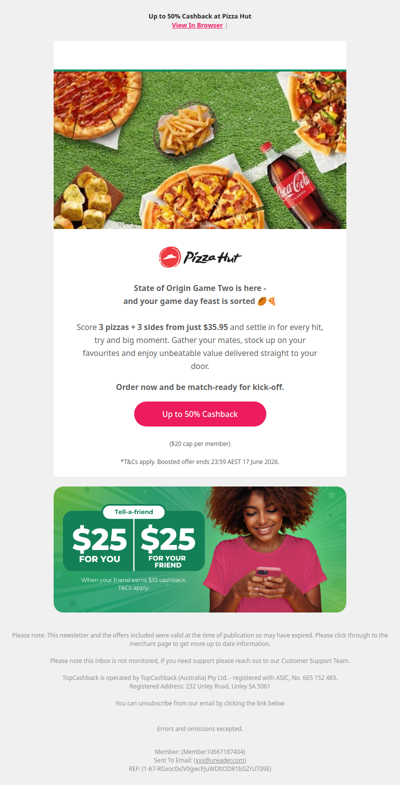
2026-6-17
Up to 50% Cashback at Pizza Hut 🍕
1
2
3
4
5
©2024 UReader
Home
Brands
Marked Emails
Followed Brands
Privacy Policy & User Agreement
![【限时2天】乐天95折优惠中!日本限定商品一次GET! [FJ]](https://api.ureader.com/mail/thumbnail/fromjapan.co.jp/1781661741027/限时2天-乐天95折优惠中-日本限定商品一次get-fj.webp)