Newsletter Search Engine
Total 316136 mails
nutriversum
HU
·
2026-6-17
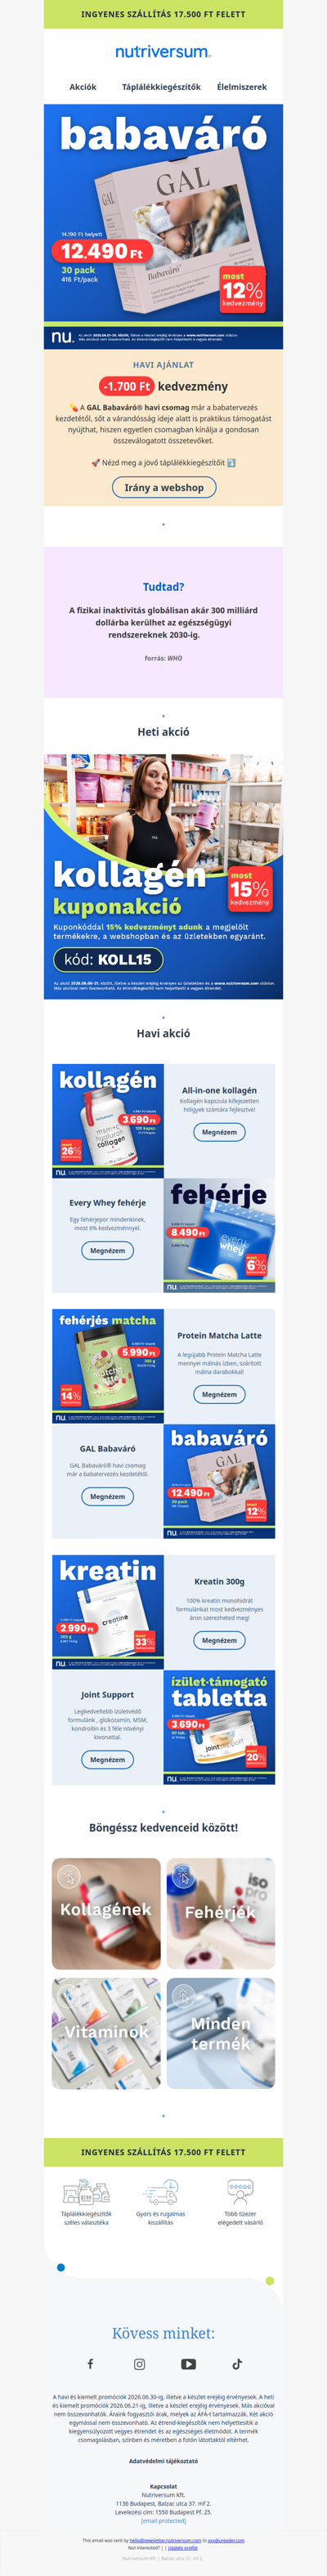
🚼Prémium vitamin csomag a babatervezéstől a várandósságig. GAL Babaváró -12% kedvezménnyel
Newsletter Search Engine

![[Fête des Pères] Jusqu'à 15% de remise !](https://api.ureader.com/mail/thumbnail/maxicoffee.com/1781668846781/fête-des-pères-jusqu-à-15-de-remise.webp)