Newsletter Search Engine
Total 315640 mails
targulcartii
RO
·
2026-6-15
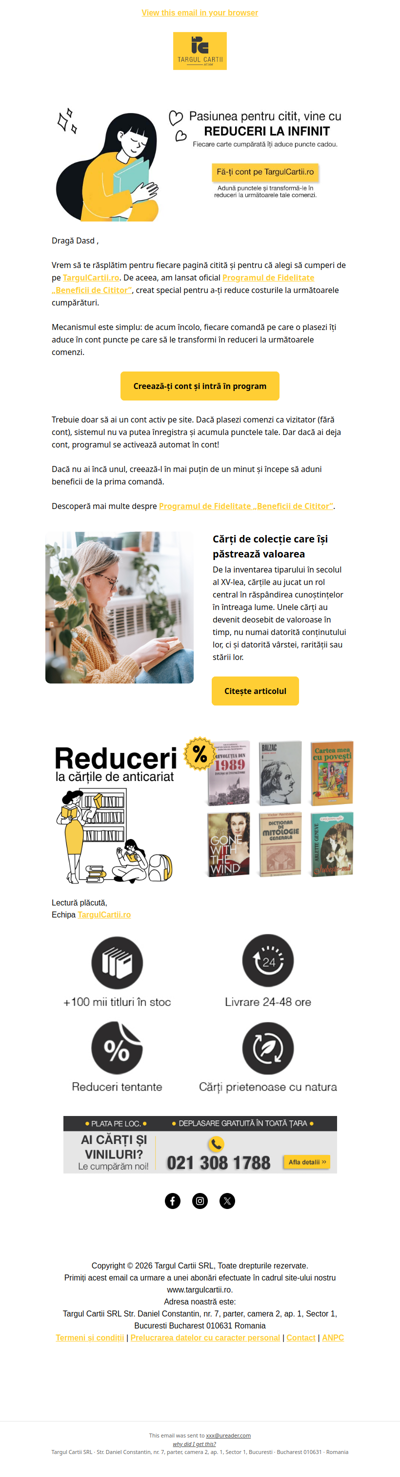
Dasd transformă-ți comenzile în REDUCERI: Descoperă programul de fidelitate
Newsletter Search Engine