Newsletter Search Engine
Total 315871 mails
latestfreestuff
GB
·
2026-6-16
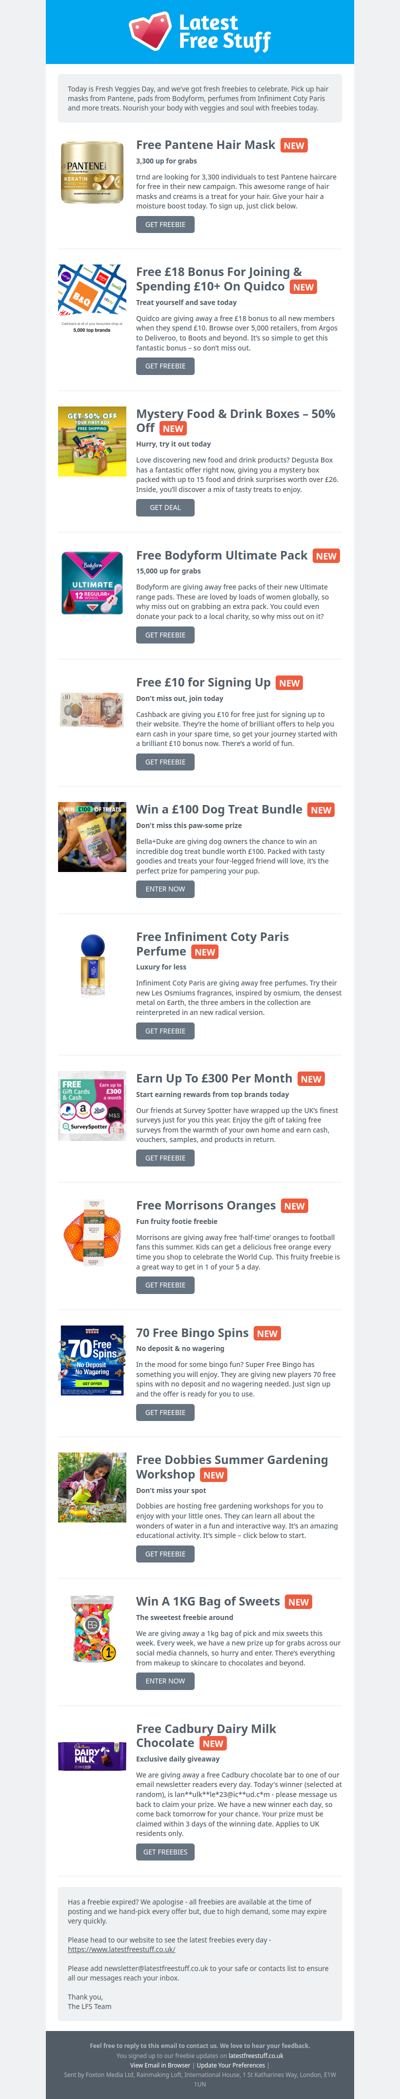
Free Pantene Hair Mask, Bodyform Pads, Infiniment Coty Paris Perfume & More

looksharpstore
NZ
·
2026-6-16
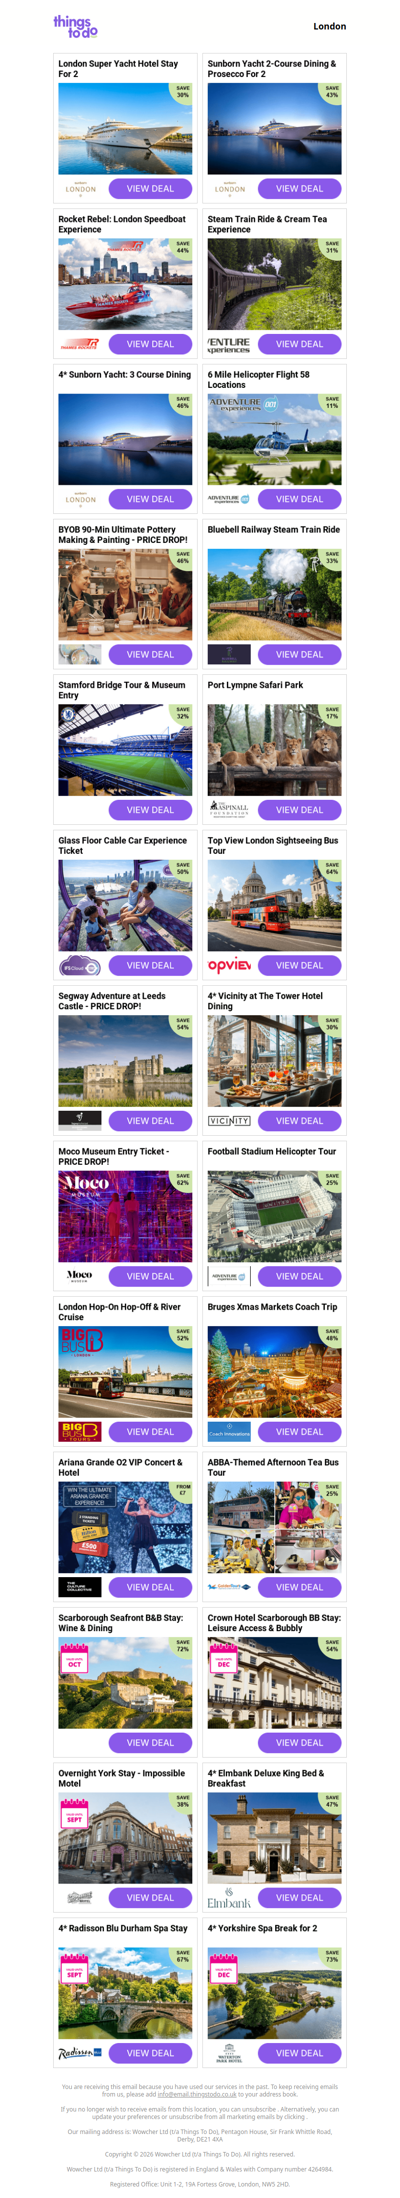
London Super Yacht Hotel Stay For 2 | Sunborn Yacht 2-Course Dining & Prosecco For 2 | Rocket Rebel: London Speedboat Experience | Steam Train Ride & Cream Tea Experience | 4* Sunborn Yacht: 3 Course Dining
livingsocial
GB
·
2026-6-16
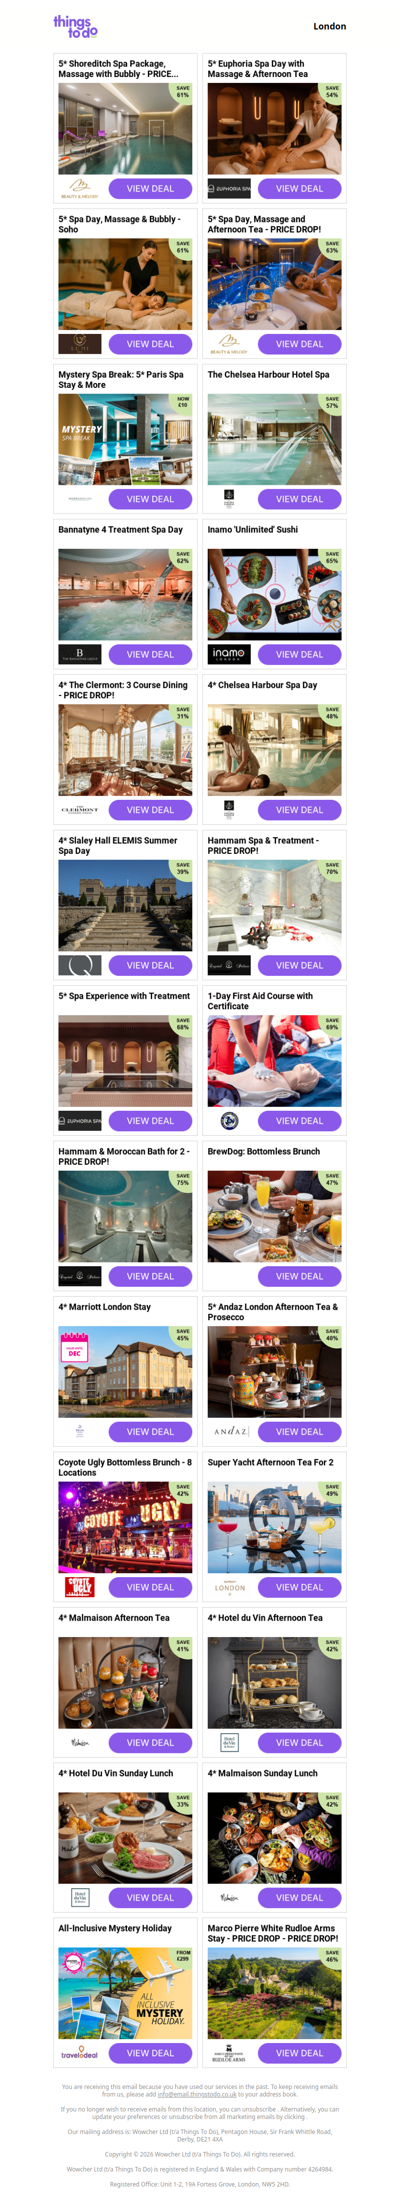
5* Shoreditch Spa Package, Massage with Bubbly - PRICE DROP! | 5* Euphoria Spa Day with Massage & Afternoon Tea | 5* Spa Day, Massage & Bubbly - Soho - PRICE DROP! | 5* Spa Day, Massage and Afternoon Tea - PRICE DROP! | Mystery Spa Break: 5* Paris Spa Stay & More