Newsletter Search Engine
Total 313894 mails
magnet-3pagen
CZ
·
2026-6-10
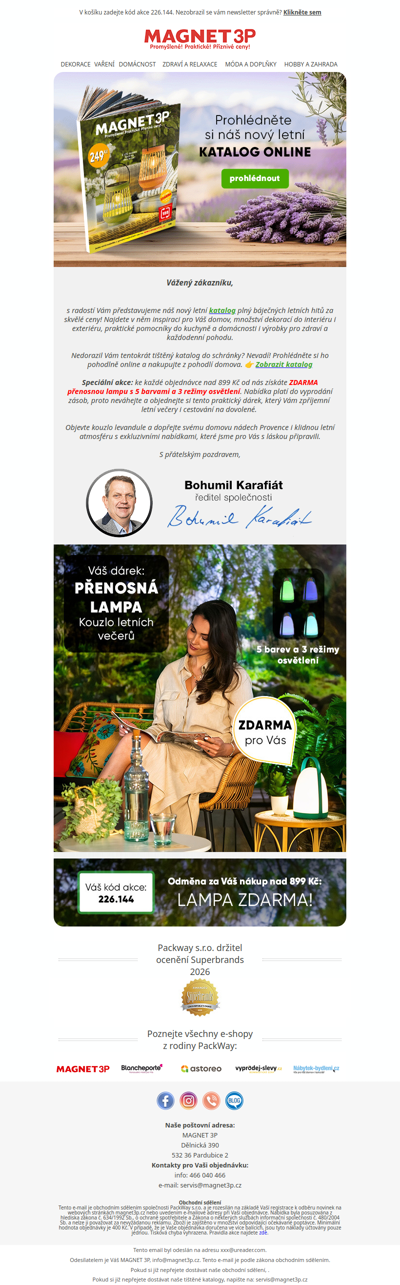
Vážený zákazníku, nový letní katalog je tady – inspirujte se a získejte dárek zdarma!
latestfreestuff
GB
·
2026-6-10
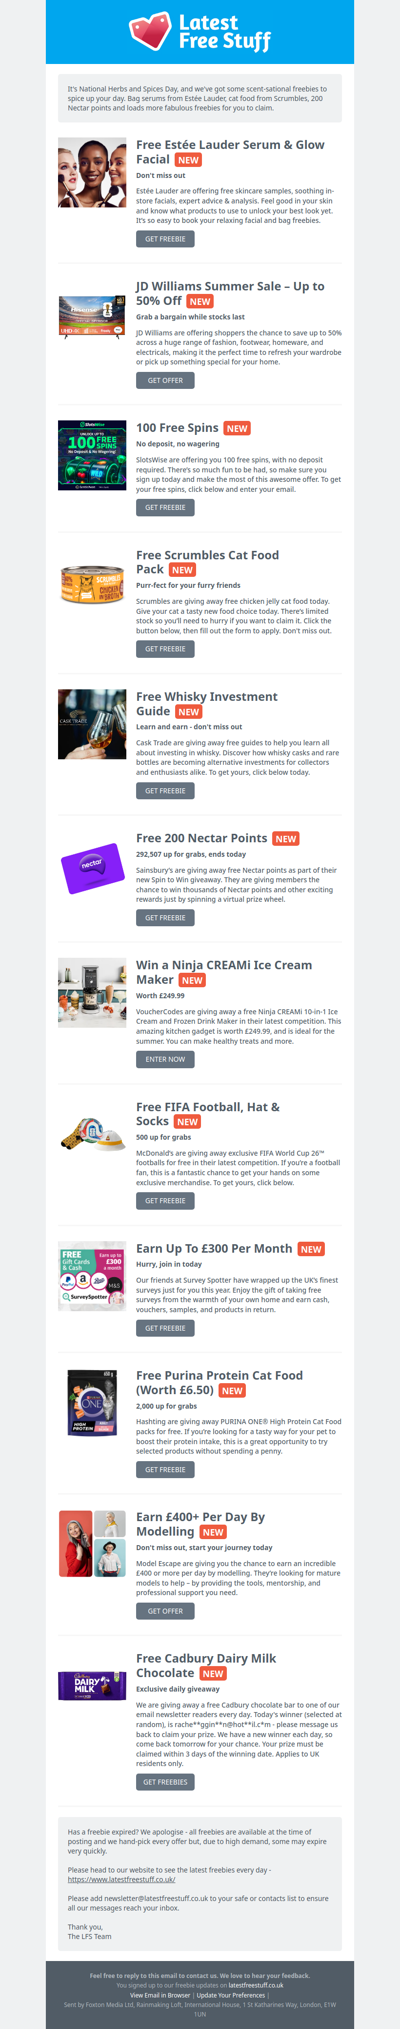
Free Estée Lauder Serum, Scrumbles Cat Food, 200 Nectar Points & More
ponudadana
HR
·
2026-6-10
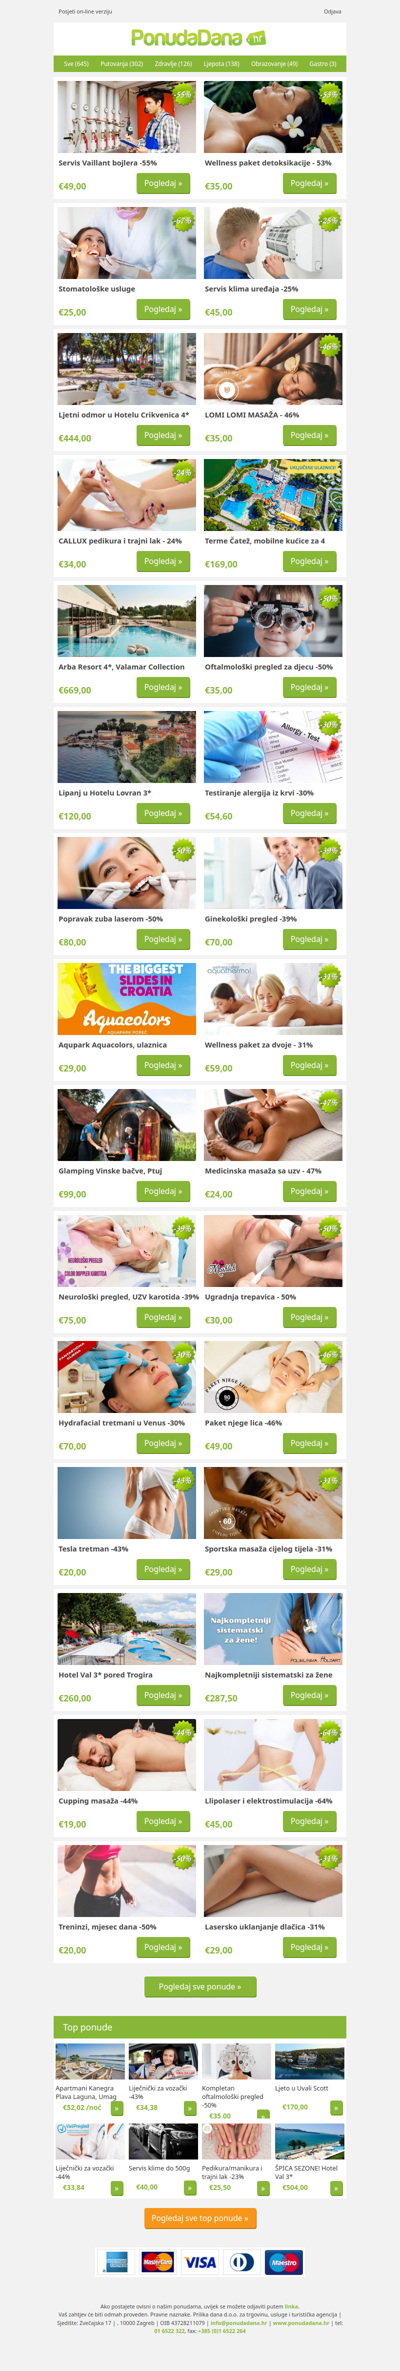
✔ Servis Vaillant bojlera -55% | Wellness paket detoksikacije - 53% | Stomatološke usluge | Servis klima uređaja -25% | Ljetni odmor u Hotelu Crikvenica 4 | LOMI LOMI MASAŽA - 46% | CALLUX pedikura i trajni lak - 24%

wikideals
ZA
·
2026-6-10
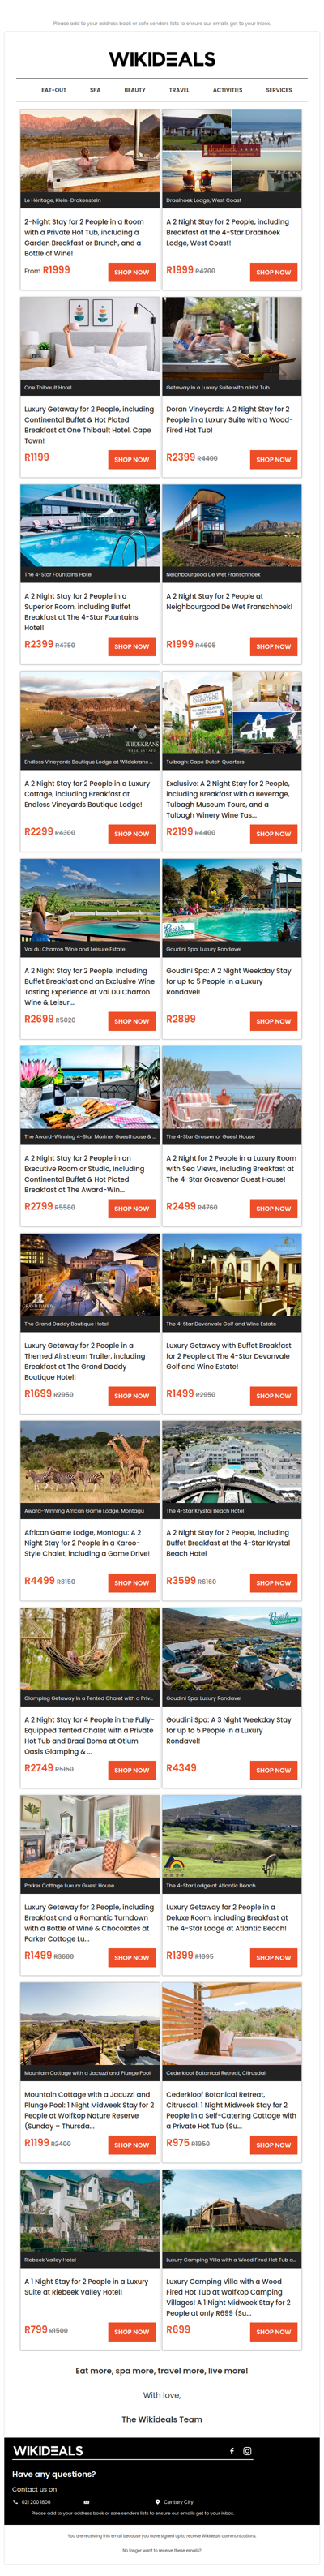
Getaway Sale: African Game Lodge | Doran Vineyards | Krystal Beach Hotel | Val du Charron Wine Estate | Endless Vineyards Boutique Lodge
banggood
GLOBAL
·
2026-6-10
![[⚡Subscribers Only! ] Unlock Bottom Prices & Save More with Extra Allowance! Blitzwolf 20000mAh Power Bank Only $16.99! More Inside>>](https://api.ureader.com/mail/thumbnail/banggood.com/1781083146974/subscribers-only-unlock-bottom-prices-save-more-with-extra-allowance-blitzwolf-20000mah-power-bank-only-16-99-more-inside.webp)
[⚡Subscribers Only! ] Unlock Bottom Prices & Save More with Extra Allowance! Blitzwolf 20000mAh Power Bank Only $16.99! More Inside>>