UReader
Brands
Sign in
Sign up
Newsletter Search Engine
Dates
2025 (205704)
2026 (60983)
2024 (51094)
Business Categories
General
(100978)
Other
(57691)
Home
(22191)
Fashion
(21205)
Electronics
(16743)
Literature
(11282)
Sports
(11223)
Art
(8606)
Machinery
(5029)
Health
(4680)
Food
(2943)
Country
GLOBAL
(36712)
CO
(19596)
NL
(17335)
AU
(17002)
GB
(14992)
NZ
(14986)
US
(13673)
BE
(13232)
DE
(8976)
FI
(8675)
CL
(7741)
CA
(7512)
PL
(7366)
RO
(7189)
ES
(6787)
HU
(6559)
ZA
(6493)
AR
(6076)
IL
(5993)
DK
(5679)
FR
(5358)
SK
(5259)
BR
(5207)
HR
(5126)
IT
(5009)
CZ
(4685)
SE
(4522)
PT
(4520)
IE
(3902)
GR
(3844)
NO
(3829)
SG
(3179)
CH
(3089)
BG
(2940)
RU
(2657)
MY
(2312)
UA
(2288)
MX
(2197)
AT
(2149)
JP
(2141)
PE
(1866)
RS
(1794)
TR
(762)
VE
(760)
IO
(676)
TW
(593)
ID
(590)
PK
(579)
IQ
(550)
HK
(500)
MA
(476)
PH
(447)
TV
(413)
AE
(322)
TH
(255)
KW
(188)
KP
(108)
VN
(54)
EG
(42)
IN
(8)
KZ
(4)
MD
(2)
NU
(2)
LT
(1)
BA
(1)
LK
(1)
Total 317781 mails
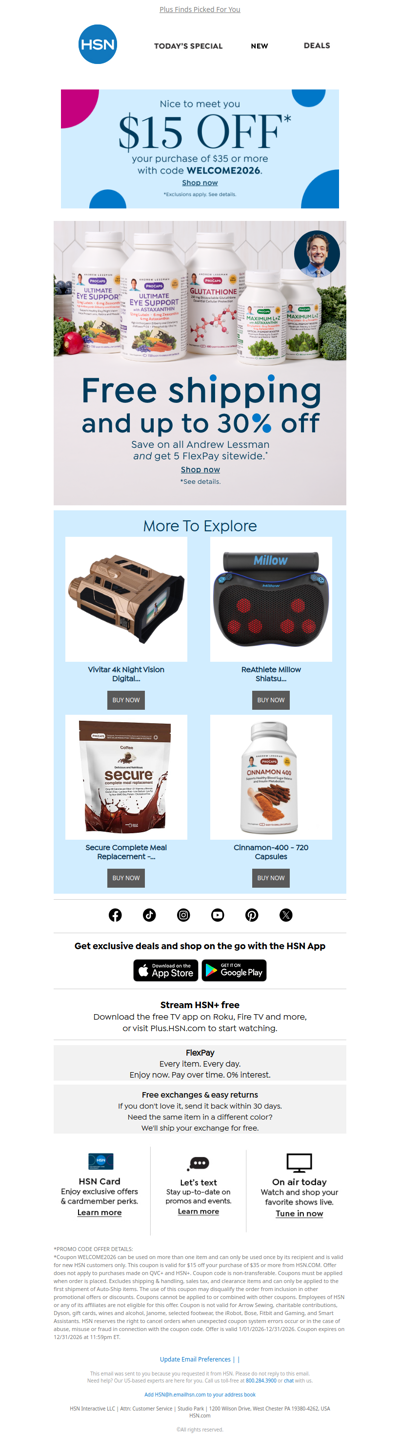
hsn
GLOBAL
·
2026-6-22
Hurry! Andrew Lessman Specials Inside
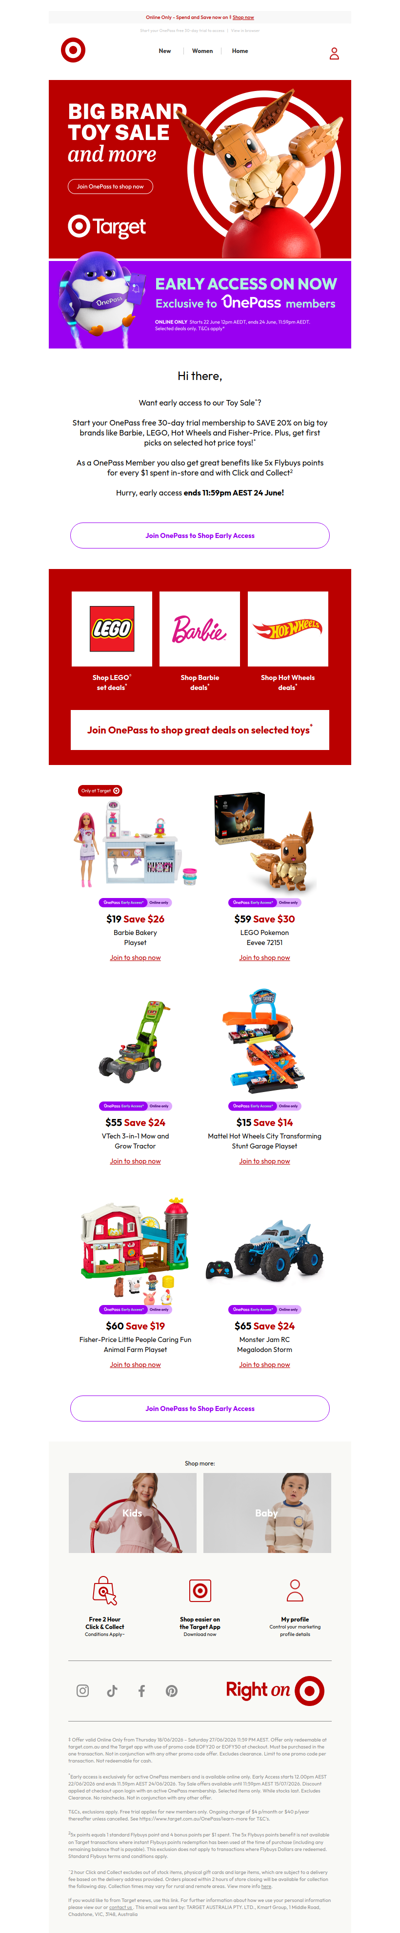
target
AU
·
2026-6-22
Toy Sale Early Access starts NOW!
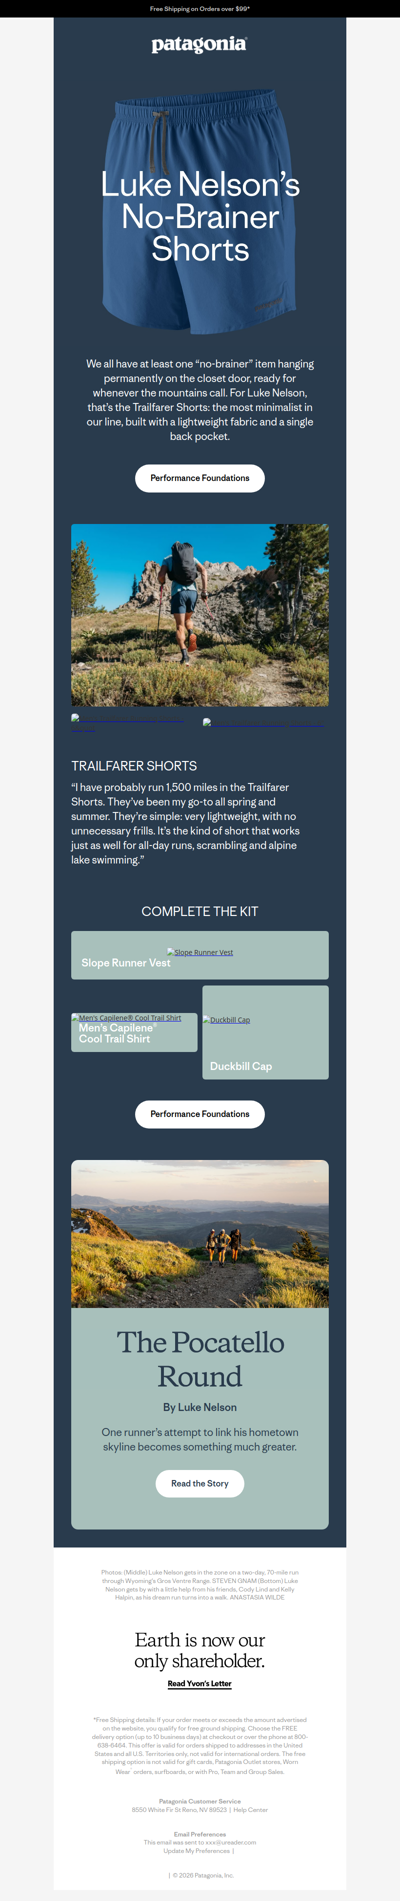
patagonia
GLOBAL
·
2026-6-22
Our ambassador’s favorite shorts
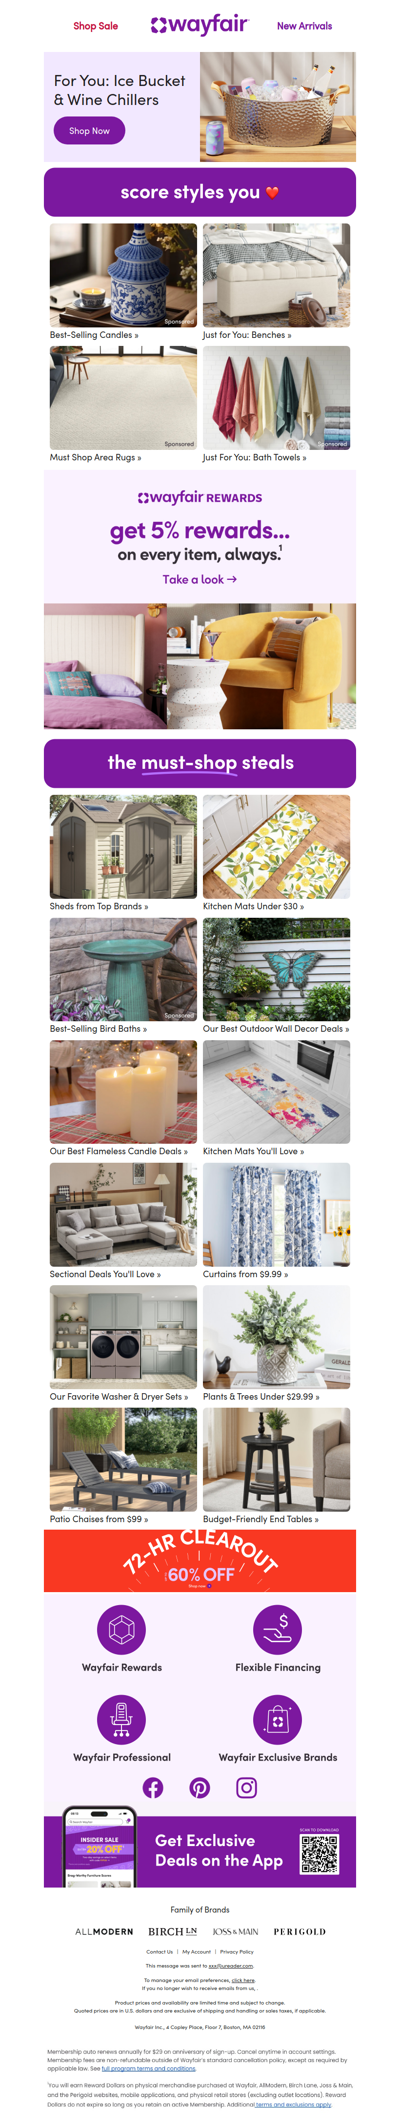
wayfair
GLOBAL
·
2026-6-22
ICE BUCKETS & WINE CHILLERS right this way➝
kmart
AU
·
2026-6-22
Latest finds, low prices 🙌
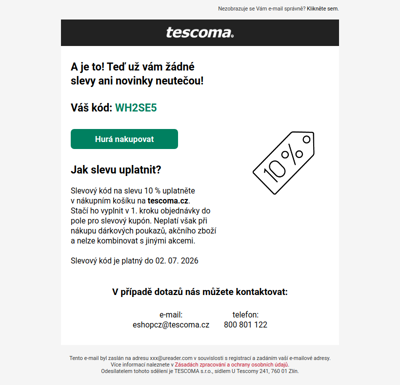
tescoma
CZ
·
2026-6-22
Tady je vaše sleva!
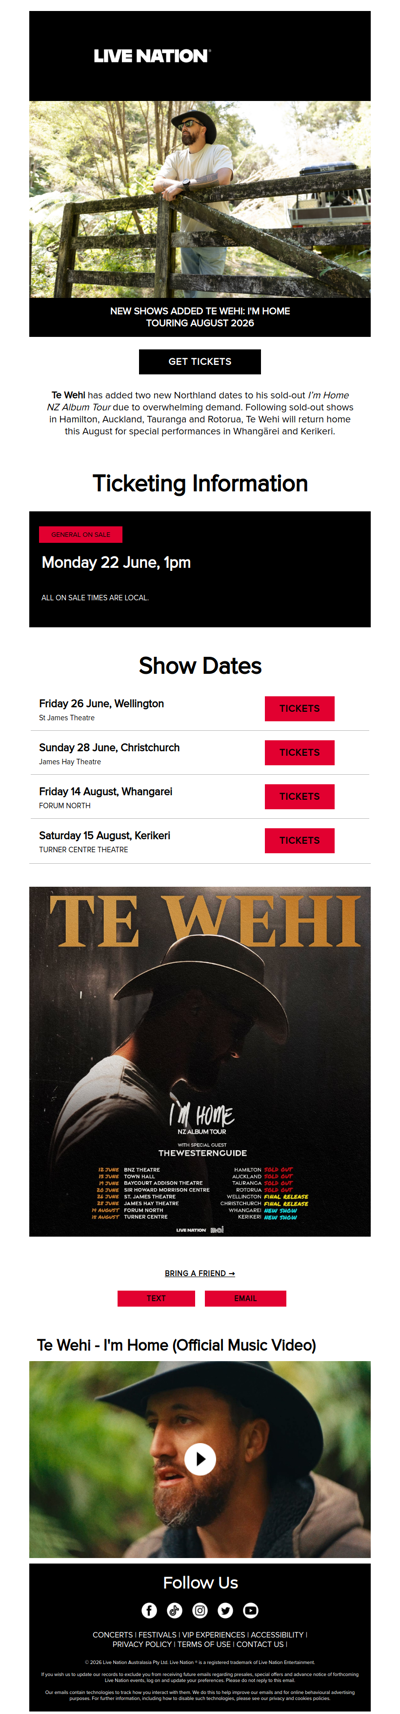
livenation
NZ
·
2026-6-22
Te Wehi announces 2 more shows to his I'm Home Album Tour
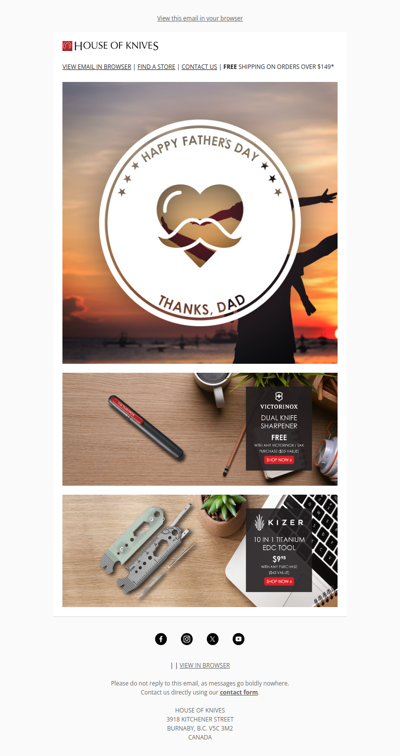
houseofknives
CA
·
2026-6-22
Happy Father's Day!
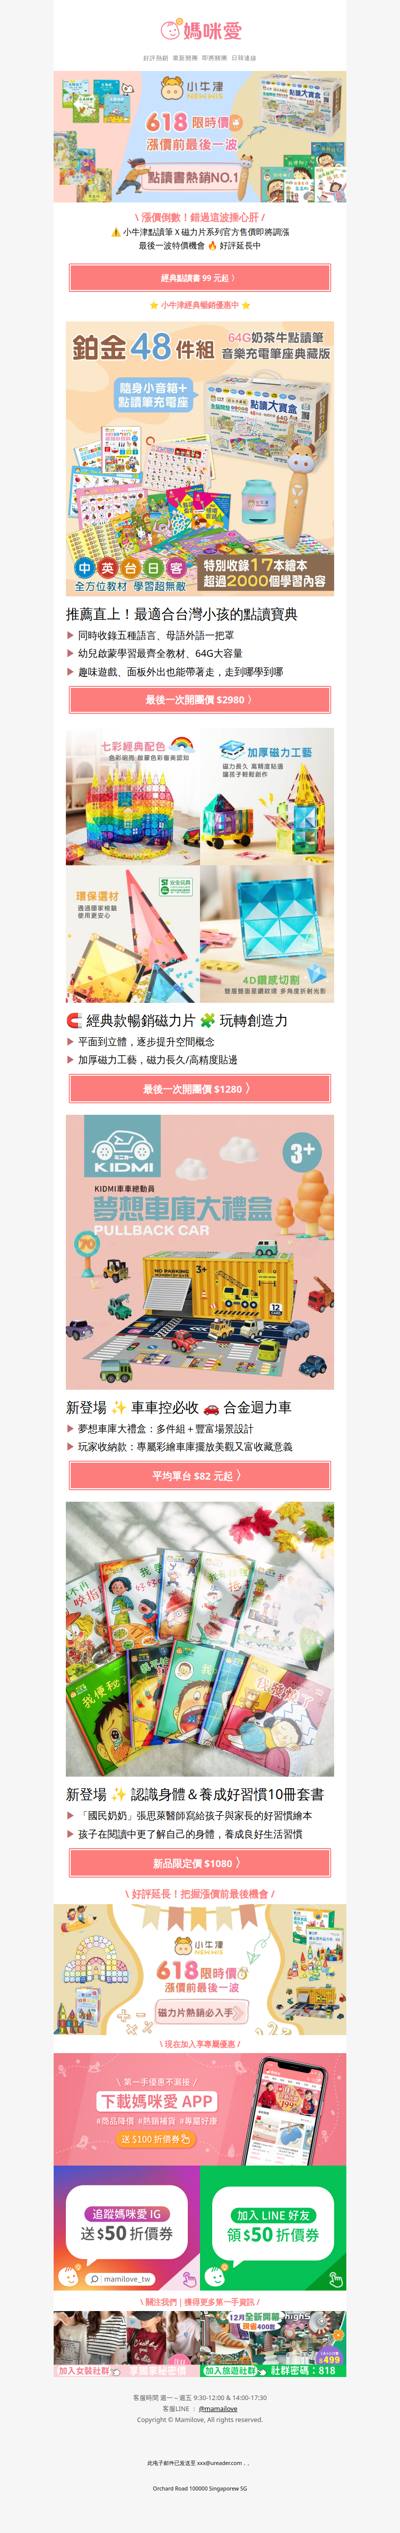
mamilove
TW
·
2026-6-22
漲價前最後機會 ⏰ 孩子的啟蒙夥伴【小牛津】
bedandbasics
SG
·
2026-6-22
Last Chance! Mid Year Sale Ends Tomorrow ⏰
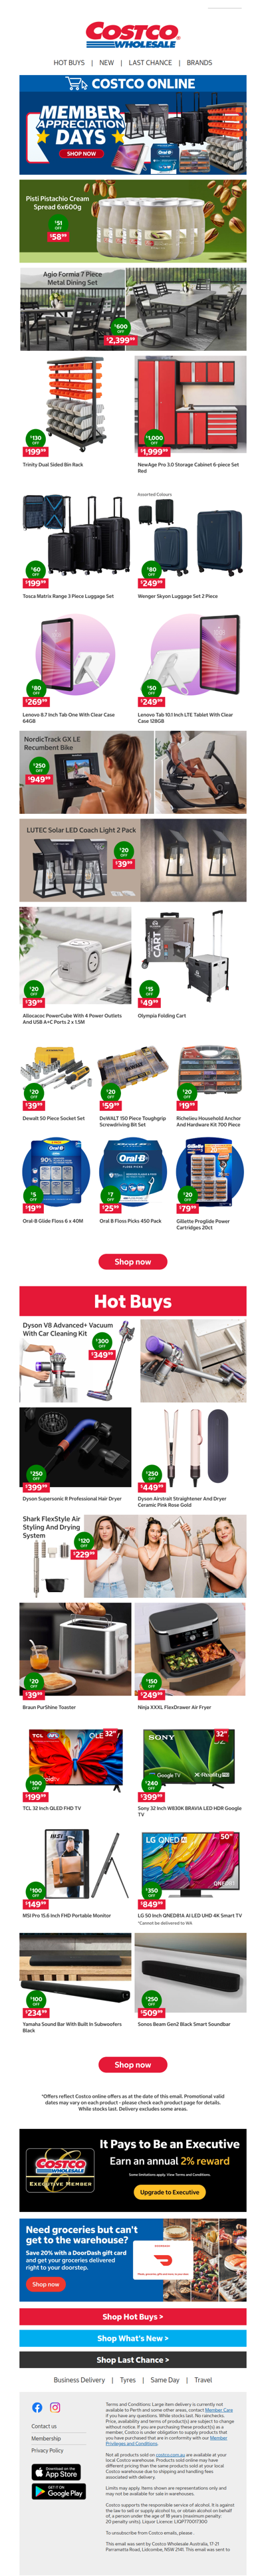
costco
AU
·
2026-6-22
Member Appreciation Days 🎁
vividseats
GLOBAL
·
2026-6-22
Your National Ticket Update
1
2
3
4
5
©2024 UReader
Home
Brands
Marked Emails
Followed Brands
Privacy Policy & User Agreement