UReader
Brands
Sign in
Sign up
Newsletter Search Engine
Dates
2025 (205704)
2026 (58884)
2024 (51094)
Business Categories
General
(100361)
Other
(57372)
Home
(22008)
Fashion
(21046)
Electronics
(16648)
Literature
(11219)
Sports
(11128)
Art
(8541)
Machinery
(5012)
Health
(4661)
Food
(2922)
Country
GLOBAL
(36402)
CO
(19584)
NL
(17256)
AU
(16823)
GB
(14900)
NZ
(14850)
US
(13581)
BE
(13182)
DE
(8930)
FI
(8613)
CL
(7683)
CA
(7468)
PL
(7326)
RO
(7150)
ES
(6760)
HU
(6517)
ZA
(6450)
AR
(5998)
IL
(5966)
DK
(5649)
FR
(5319)
SK
(5232)
BR
(5174)
HR
(5089)
IT
(4989)
CZ
(4662)
PT
(4497)
SE
(4485)
IE
(3860)
GR
(3829)
NO
(3797)
SG
(3148)
CH
(3061)
BG
(2924)
RU
(2626)
MY
(2290)
UA
(2266)
MX
(2172)
AT
(2132)
JP
(2126)
PE
(1852)
RS
(1775)
TR
(757)
VE
(754)
IO
(670)
TW
(590)
ID
(590)
PK
(577)
IQ
(544)
HK
(499)
MA
(476)
PH
(440)
TV
(410)
AE
(319)
TH
(252)
KW
(188)
KP
(108)
VN
(54)
EG
(42)
IN
(8)
KZ
(4)
MD
(2)
NU
(2)
LT
(1)
BA
(1)
LK
(1)
Total 315682 mails
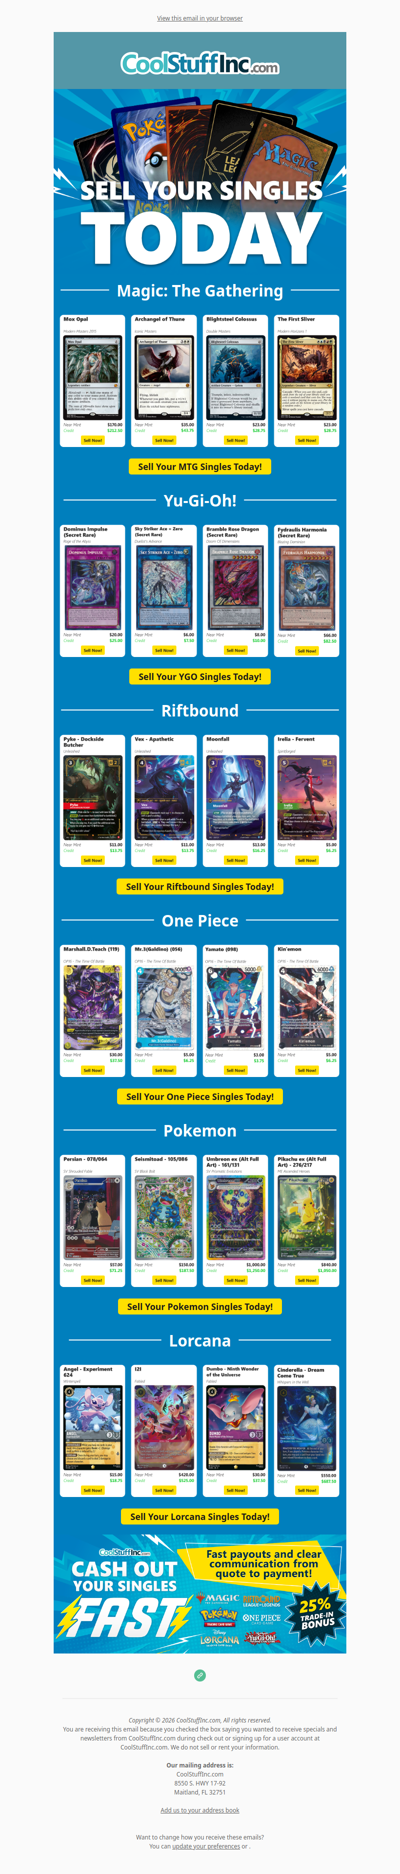
coolstuffinc
IQ
·
2026-6-16
High EV Play: Sell Your Cards 💰
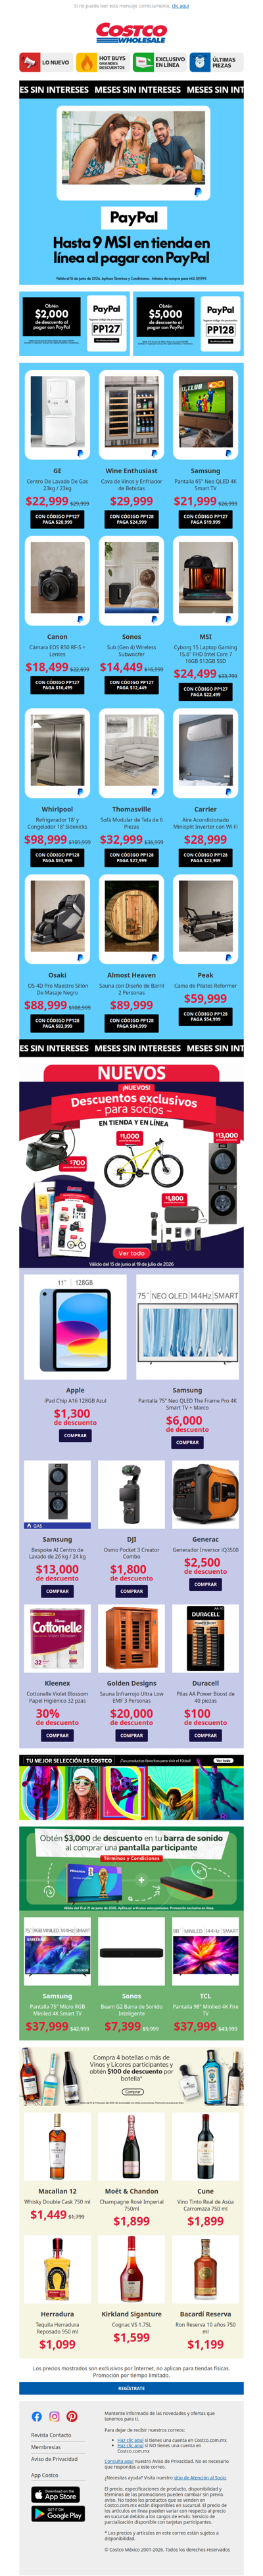
costco
MX
·
2026-6-16
Hasta 9 MSI en la Tienda en Línea al Pagar con PayPal
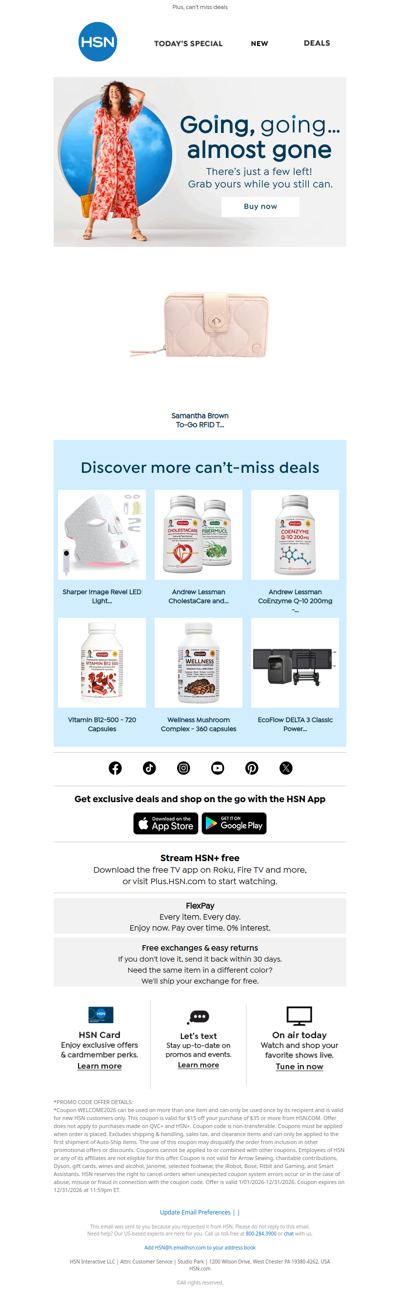
hsn
GLOBAL
·
2026-6-16
Your Pick Is Almost Gone!
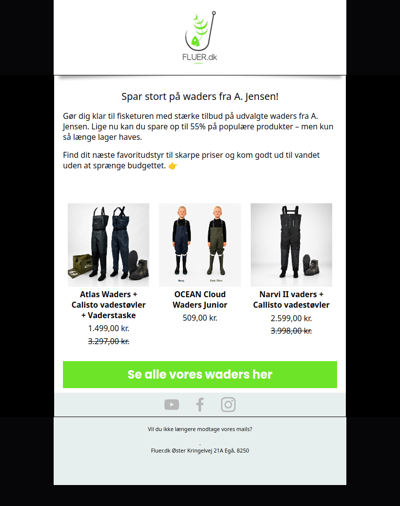
fluer
DK
·
2026-6-16
Stort udvalg af waders til skarpe priser! 🐟
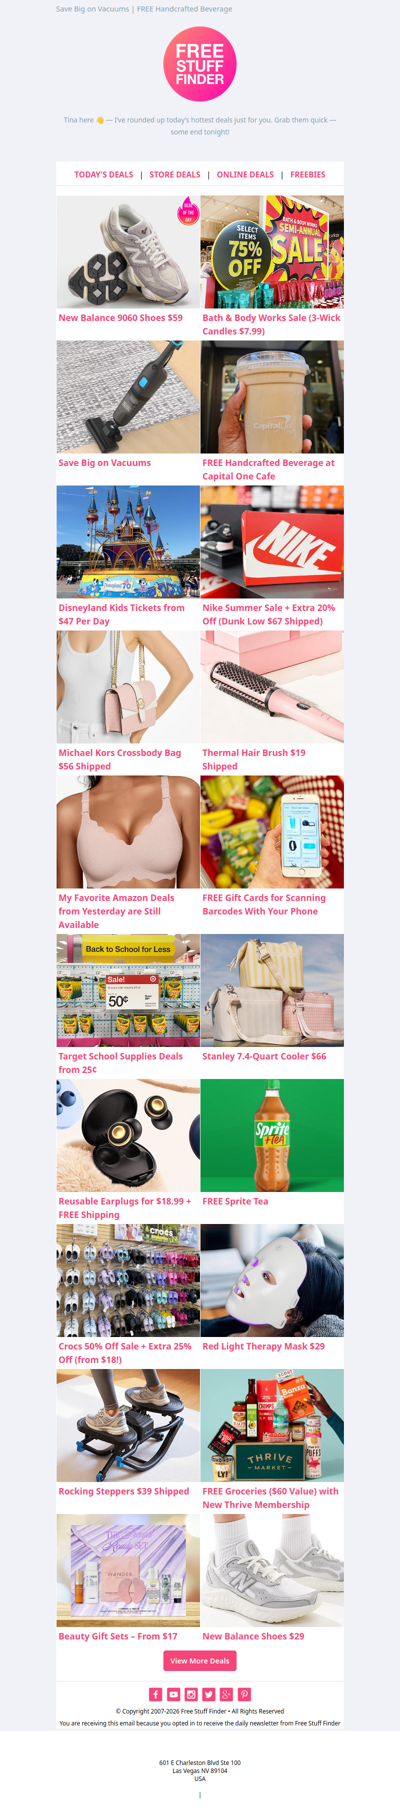
freestufffinder
VE
·
2026-6-16
😱 New Balance 9060 Shoes $59 🎀 Bath & Body Works Semi-Annual Sale
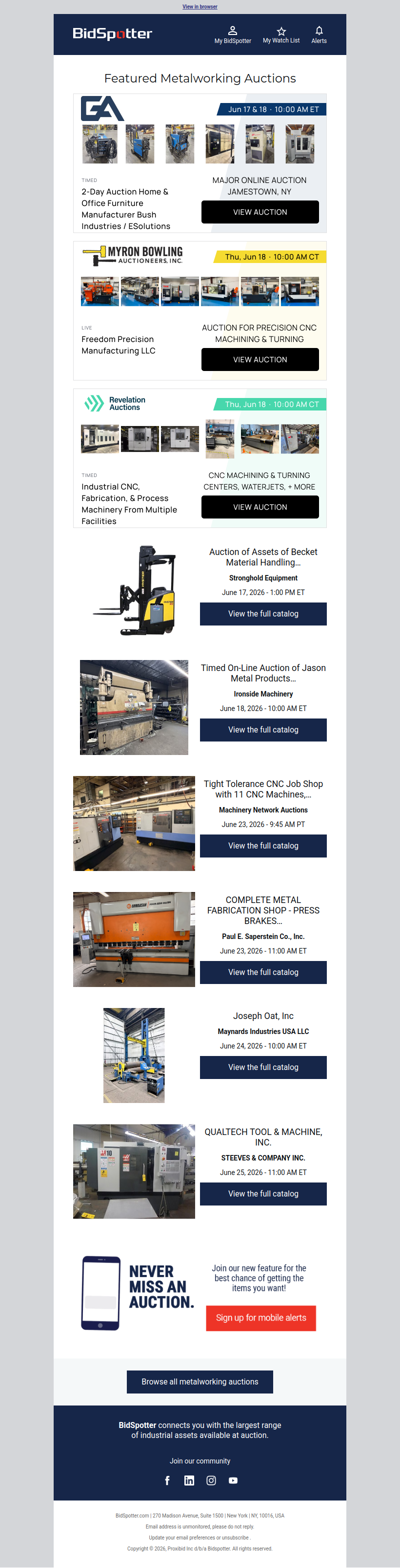
bidspotter
CA
·
2026-6-16
Featured Metalworking Auctions
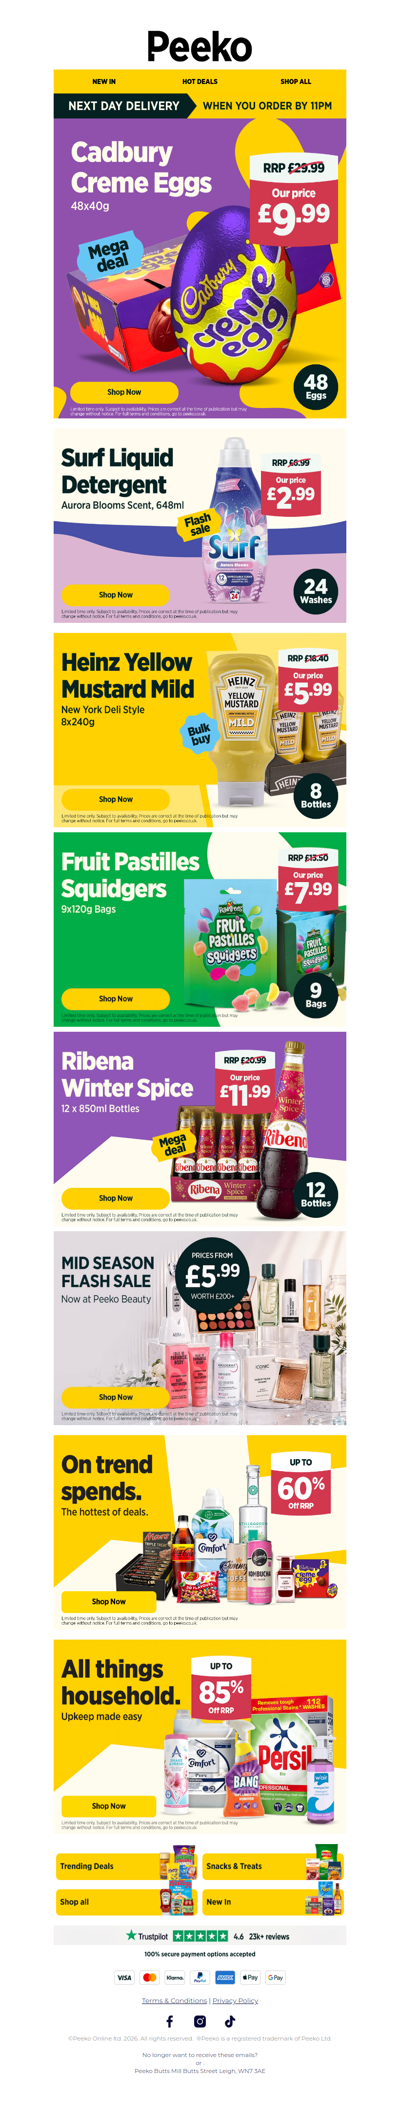
discountdragon
GB
·
2026-6-16
48 Creme Eggs for just £9.99!
therealreal
GLOBAL
·
2026-6-16
Don’t miss our exclusive June offer
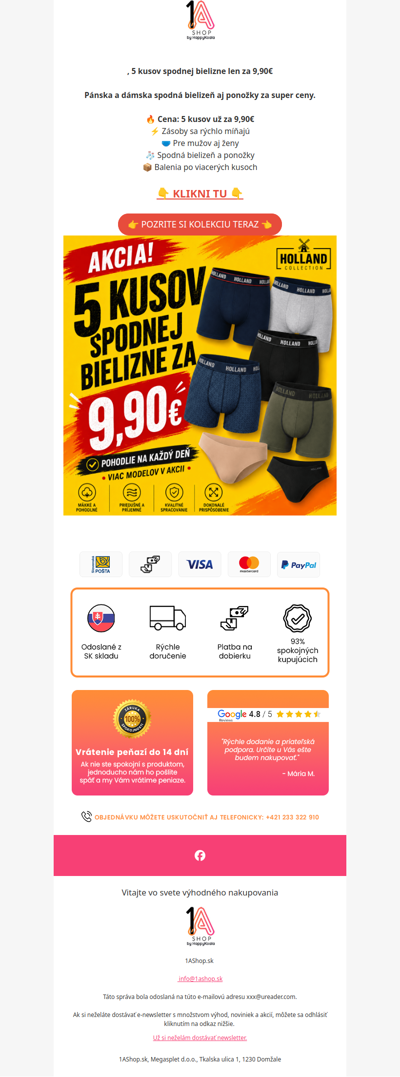
1ashop
SK
·
2026-6-16
, 5 kusov spodnej bielizne za 9,90€
groupon
ES
·
2026-6-16
Tratamiento reafirmante inyectado facial ahora es más barato – Descúbrelo.
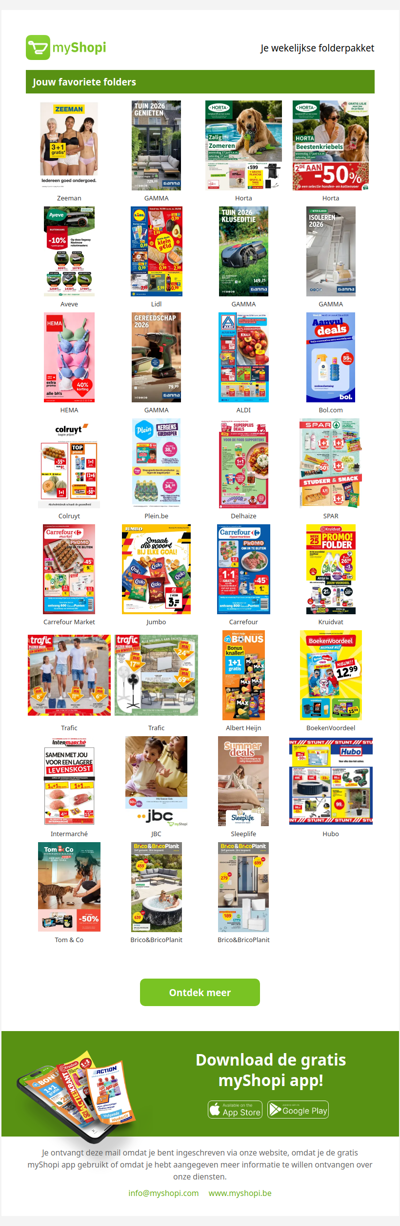
myshopi
BE
·
2026-6-16
Je wekelijkse folderpakket
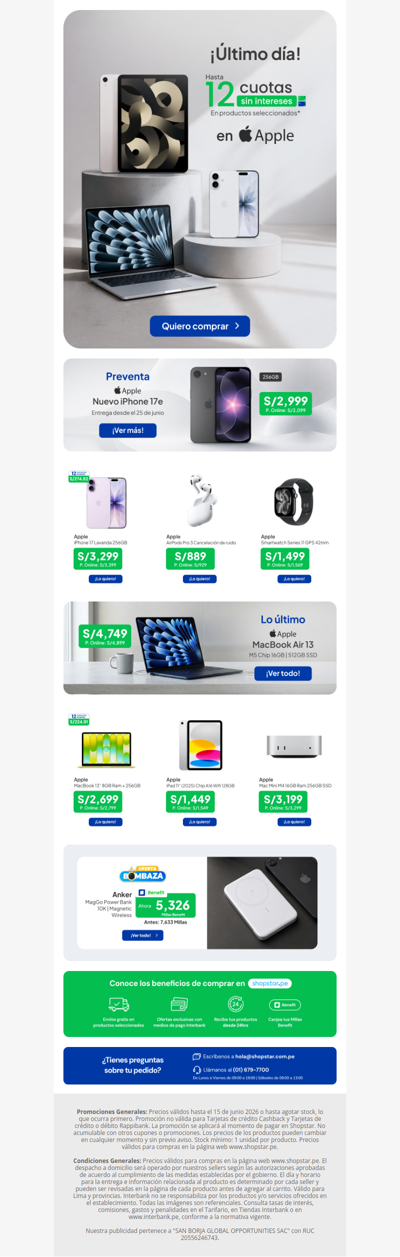
shopstar
PE
·
2026-6-16
🚨 Apple lovers, esto está volando👀
1
2
3
4
5
©2024 UReader
Home
Brands
Marked Emails
Followed Brands
Privacy Policy & User Agreement