Newsletter Search Engine
Total 313666 mails
bazarhorizonte
BR
·
2026-6-10
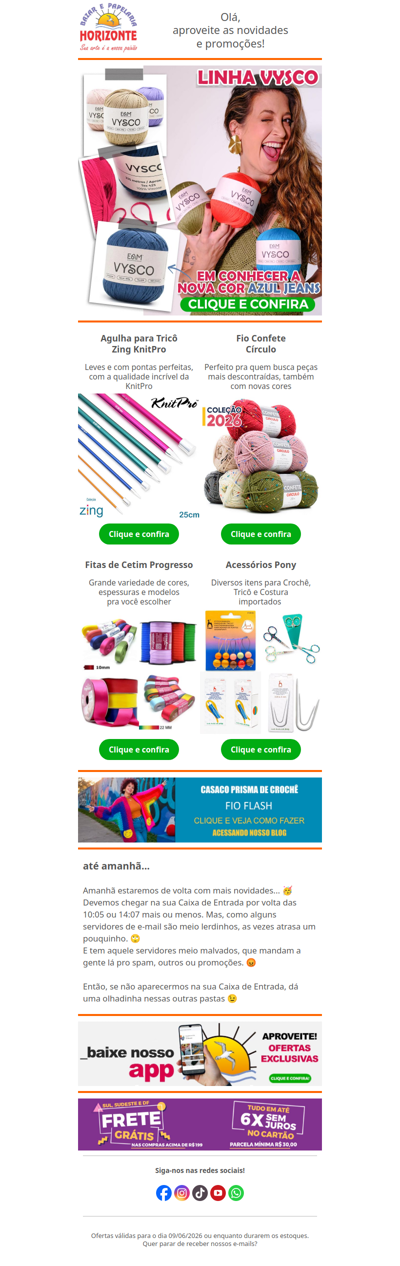
Linha Vysco com NOVA COR, Promoção de Fios Pingouin, Agulhas, Colas e Miçangas. Vem ver!😍
Newsletter Search Engine