Newsletter Search Engine
Total 314900 mails


![(日本 Mercari 超级大促销开跑中)Mercari JP 商品享 8% OFF,还有更多优惠![FJ]](https://api.ureader.com/mail/thumbnail/fromjapan.co.jp/1781312500448/日本-mercari-超级大促销开跑中-mercari-jp-商品享-8-off-还有更多优惠-fj.webp)

retravision
AU
·
2026-6-13
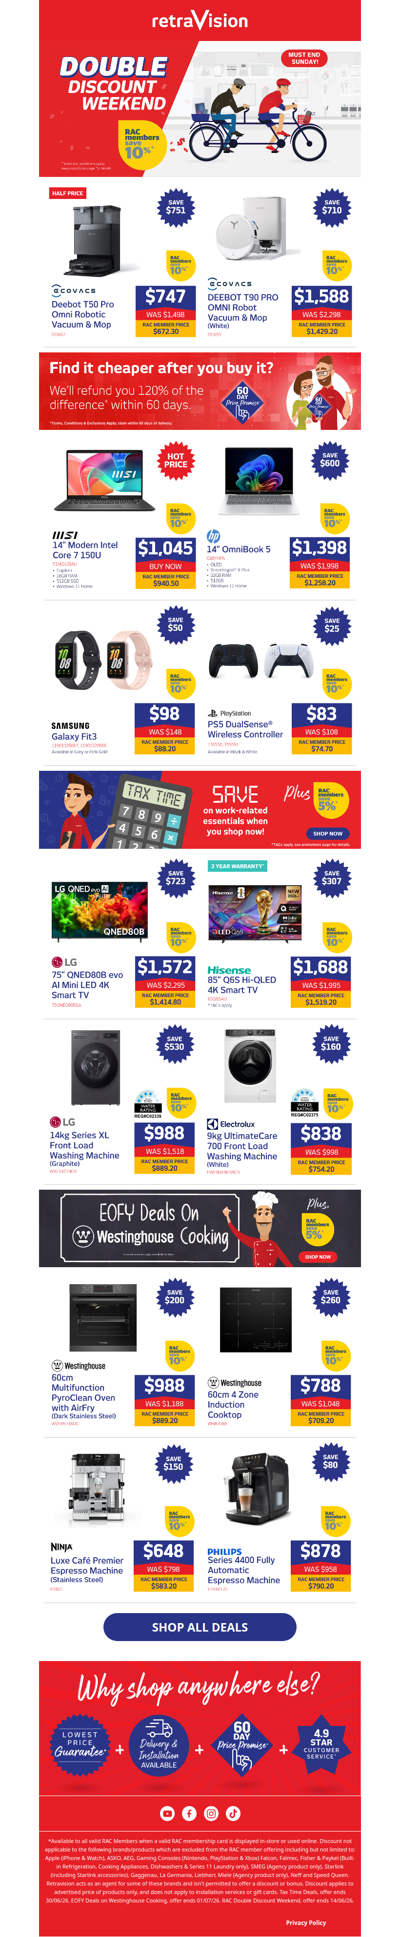
RAC Members, save an extra 10% on Ecovacs Robot Vacuums, LG TVs, Westinghouse Ovens & heaps more!
Newsletter Search Engine