Newsletter Search Engine
Total 313472 mails

koneporssi
FI
·
2026-6-9
Konepörssi: Kuljetusliike Trans Härmä Oy on vuoden 2026 SKAL Kuljetusyritys


socialdeal
NL
·
2026-6-9
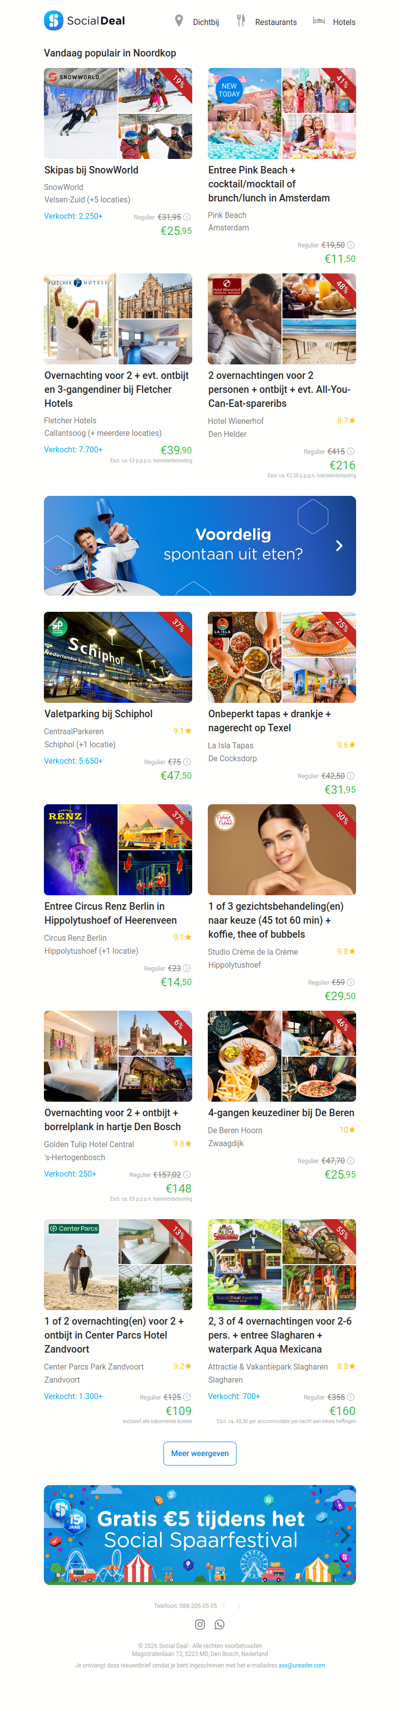
Entree Pink Beach + cocktail/mocktail of brunch/lunch in Amsterdam | Skipas bij SnowWorld