Newsletter Search Engine
Total 317429 mails
vidaxl
FR
·
2026-6-21
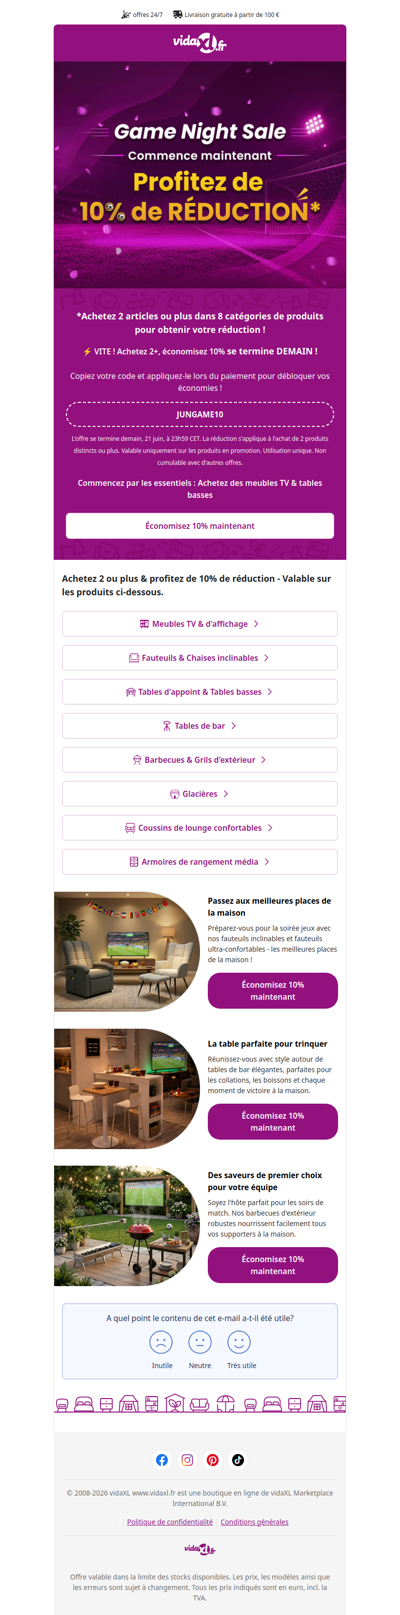
Soldes du week-end : Achetez 2+, économisez 10% | Améliorez votre soirée jeux !
Newsletter Search Engine