Newsletter Search Engine
Total 315070 mails


casaideas
PE
·
2026-6-13

🎉 Hoy ganas tú: S/20 en tu compra por compras mayores a S/199-¡Exclusivo online!
libromar
CL
·
2026-6-13
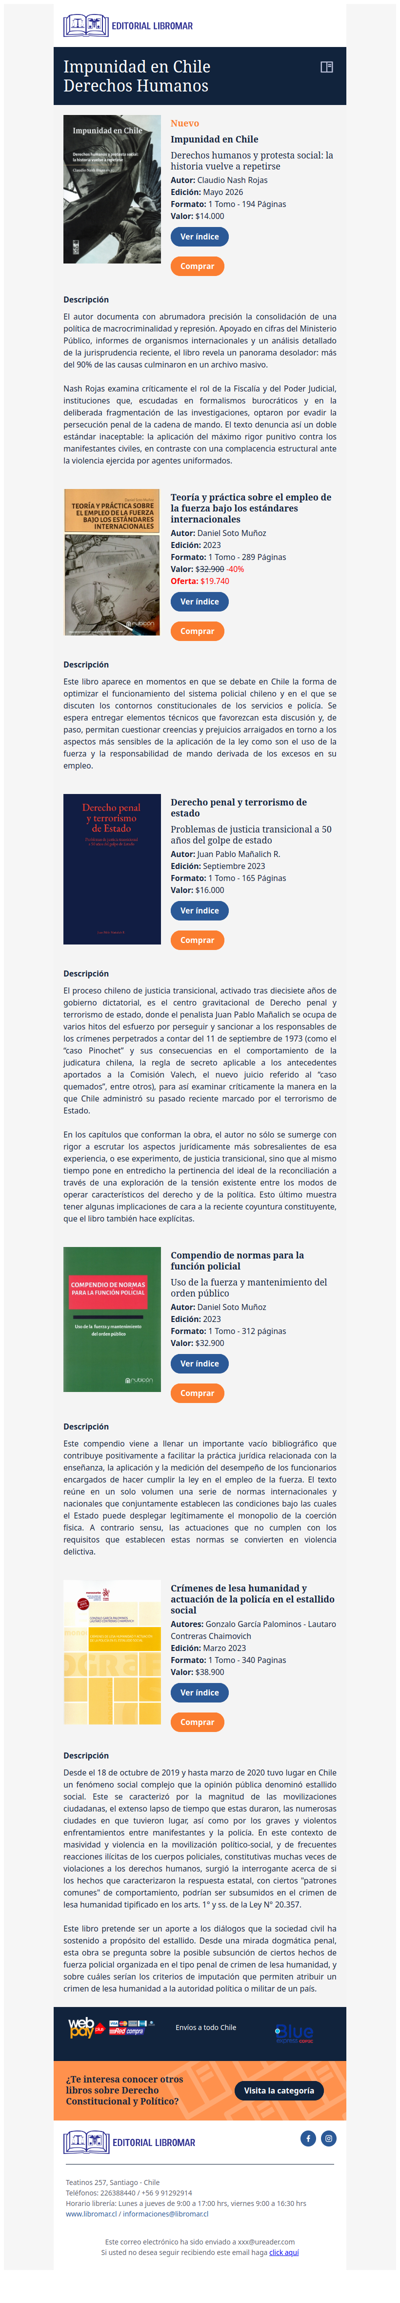
Impunidad en Chile - Derechos humanos y protesta social: la historia vuelve a repetirse (Claudio Nash R.)