Newsletter Search Engine
Total 315176 mails

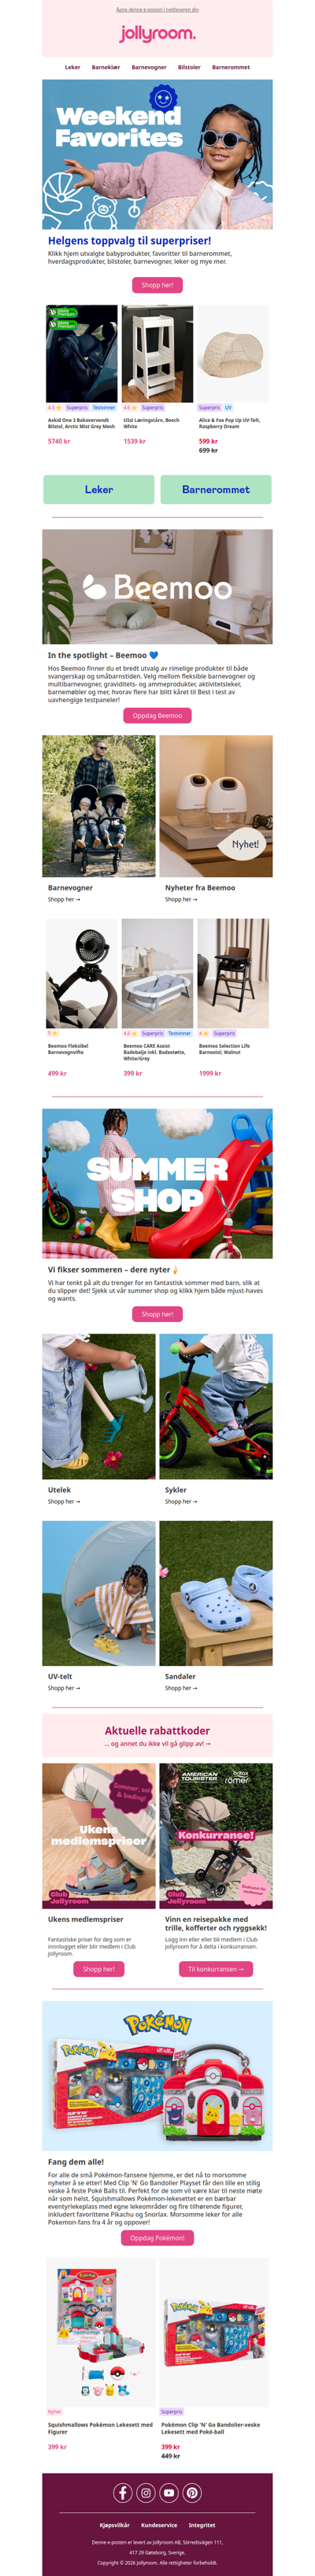
jollyroom
SE
·
2026-6-14
Helgens topp picks till superpris! ✨Shoppa Axkid, tiSsi, Baby Brezza, Owlet och fler
shop
IL
·
2026-6-14

היי, קופונים אישיים ומבצעים שלא תרצו לפספס מחכים לכם עכשיו בסופר-פארם >> | פרסומת
super-pharm
IL
·
2026-6-14
היי, קופונים אישיים ומבצעים שלא תרצו לפספס מחכים לכם עכשיו בסופר-פארם >> | פרסומת
socialdeal
BE
·
2026-6-14
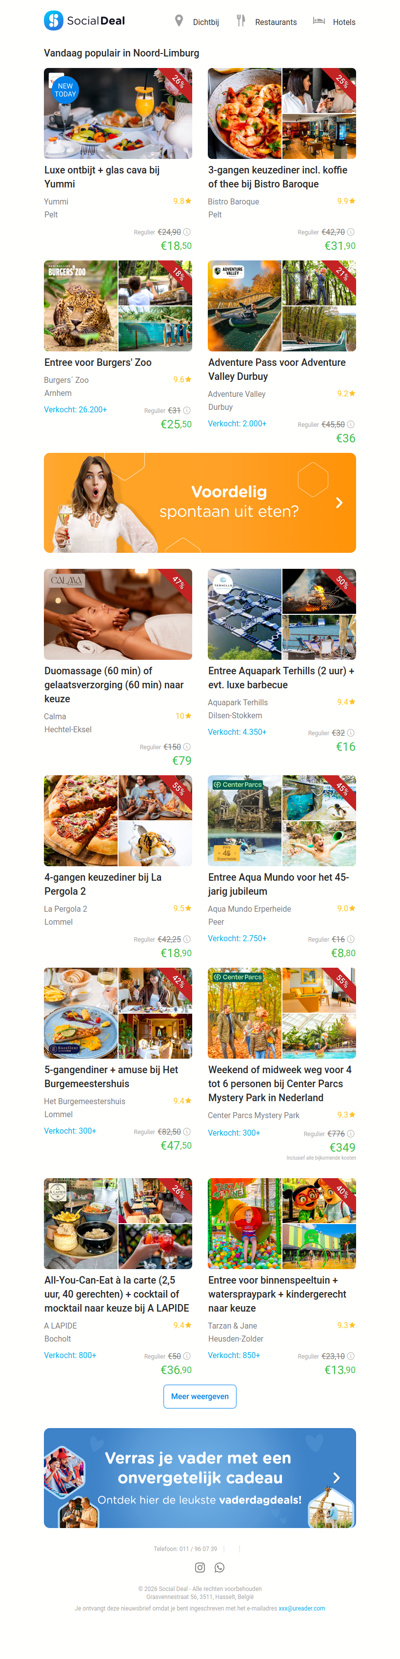
Luxe ontbijt + glas cava bij Yummi | 3-gangen keuzediner incl. koffie of thee bij Bistro Baroque
jollyroom
NO
·
2026-6-14
Helgens prisfest avsluttes i dag!⏰Shopp Axkid, tiSsi, Baby Brezza, Owlet og fler