UReader
Brands
Sign in
Sign up
Newsletter Search Engine
Dates
2025 (205704)
2026 (59188)
2024 (51094)
Business Categories
General
(100446)
Other
(57417)
Home
(22030)
Fashion
(21069)
Electronics
(16664)
Literature
(11231)
Sports
(11139)
Art
(8547)
Machinery
(5015)
Health
(4665)
Food
(2926)
Country
GLOBAL
(36445)
CO
(19585)
NL
(17268)
AU
(16852)
GB
(14912)
NZ
(14864)
US
(13596)
BE
(13191)
DE
(8936)
FI
(8621)
CL
(7690)
CA
(7475)
PL
(7331)
RO
(7159)
ES
(6762)
HU
(6525)
ZA
(6457)
AR
(6004)
IL
(5971)
DK
(5654)
FR
(5324)
SK
(5238)
BR
(5179)
HR
(5096)
IT
(4992)
CZ
(4666)
PT
(4500)
SE
(4489)
IE
(3869)
GR
(3829)
NO
(3802)
SG
(3154)
CH
(3064)
BG
(2926)
RU
(2633)
MY
(2294)
UA
(2271)
MX
(2176)
AT
(2135)
JP
(2127)
PE
(1853)
RS
(1780)
TR
(758)
VE
(754)
IO
(670)
TW
(590)
ID
(590)
PK
(577)
IQ
(544)
HK
(499)
MA
(476)
PH
(441)
TV
(410)
AE
(319)
TH
(252)
KW
(188)
KP
(108)
VN
(54)
EG
(42)
IN
(8)
KZ
(4)
MD
(2)
NU
(2)
LT
(1)
BA
(1)
LK
(1)
Total 315986 mails
authogar
AR
·
2026-6-16
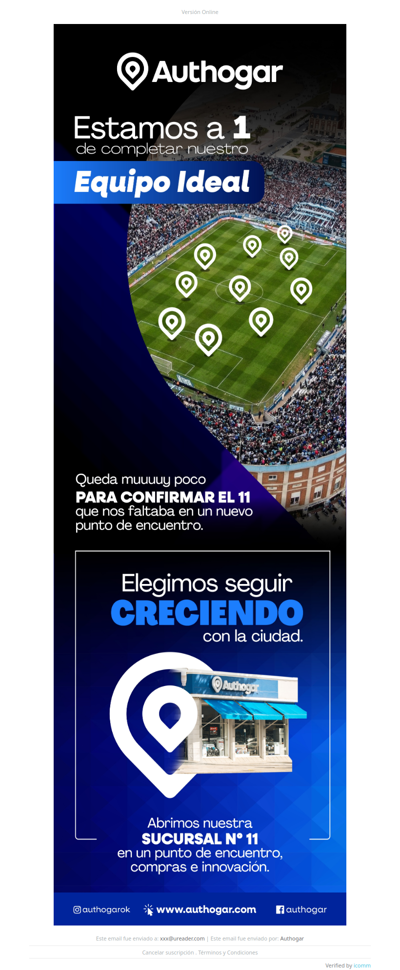
¡Estamos a 1 de completar el equipo ideal!
santil
BR
·
2026-6-17
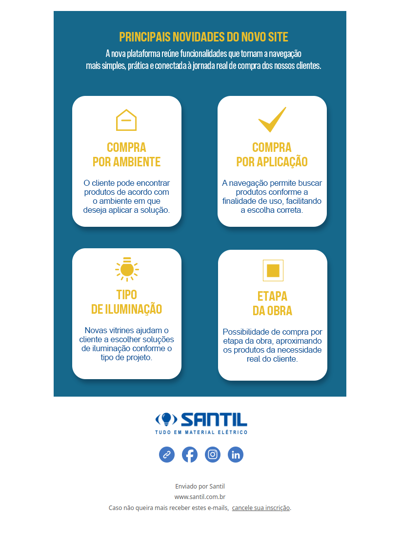
Novo Site Santil. Conheça a nova experiência, muito mais fácil de comprar!
misterspex
CH
·
2026-6-17
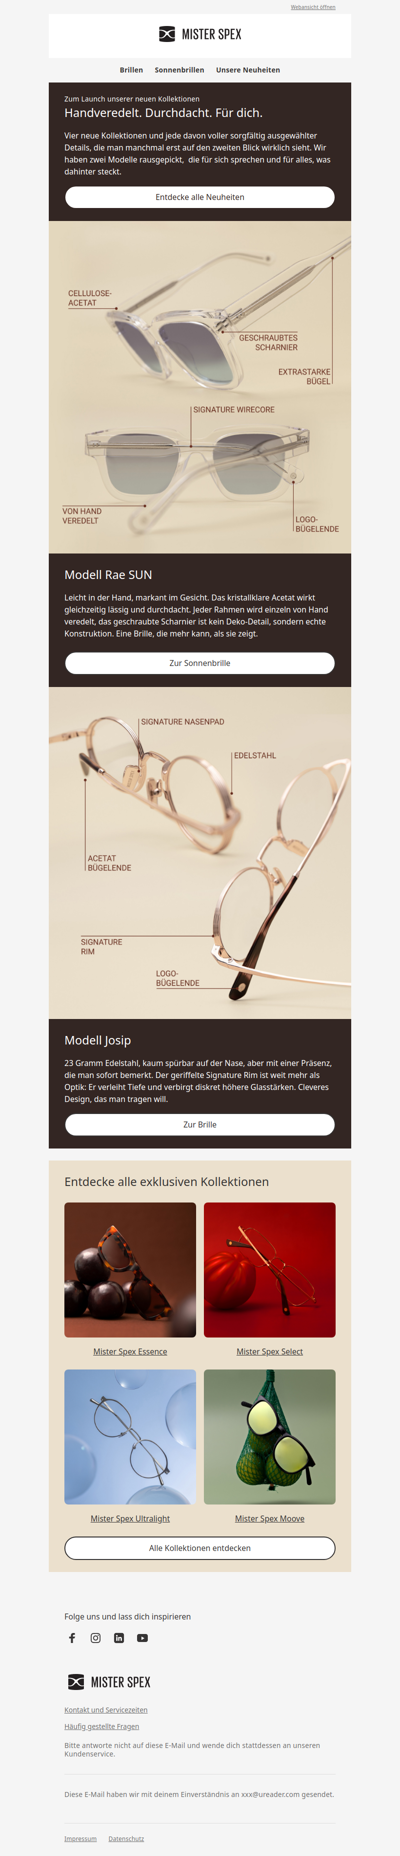
Unsere exklusiven Kollektionen: Premium-Qualität für jeden Tag
goodie
PL
·
2026-6-17
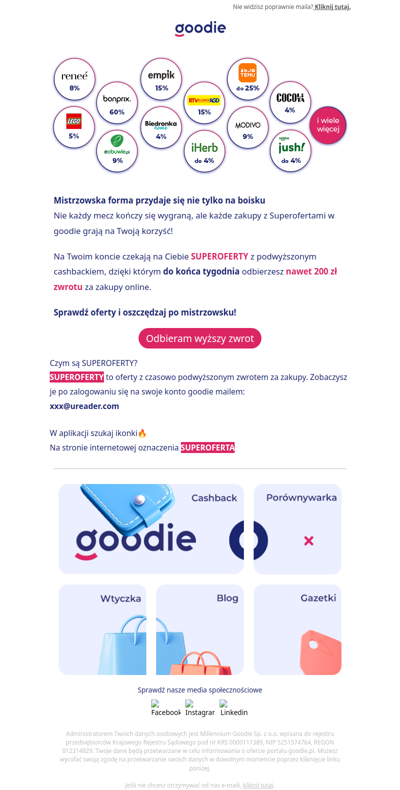
Nawet 200 zł cashbacku w wybranych sklepach
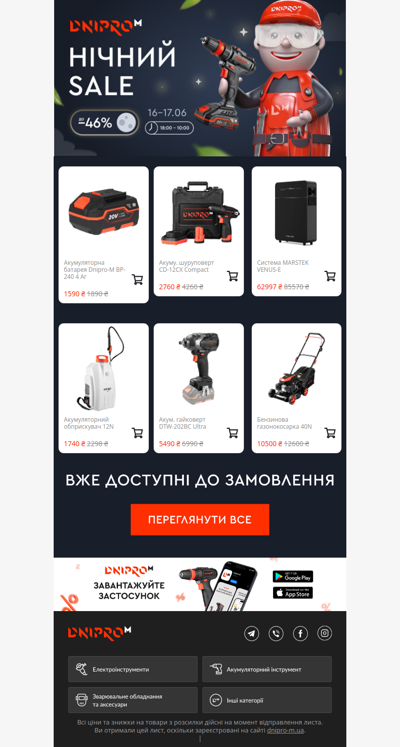
dnipro-m
UA
·
2026-6-17
🌙 Нічний SALE! Знижки до -46%
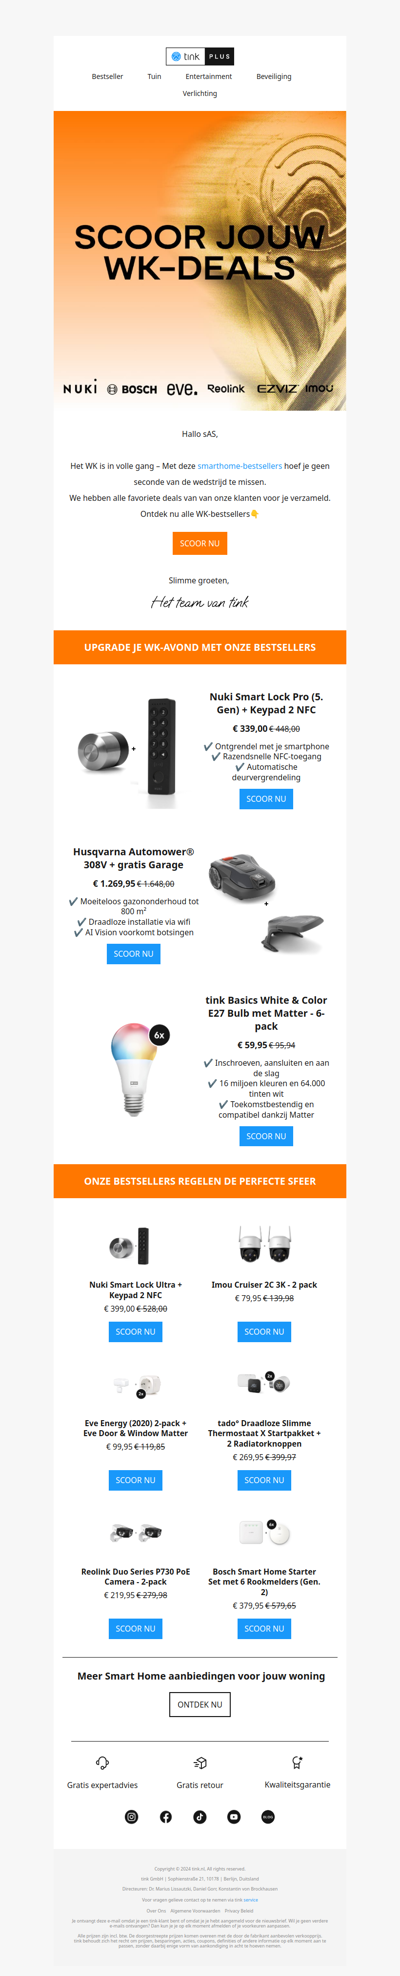
tink
NL
·
2026-6-17
🏆 De beste smart home deals voor het WK 2026
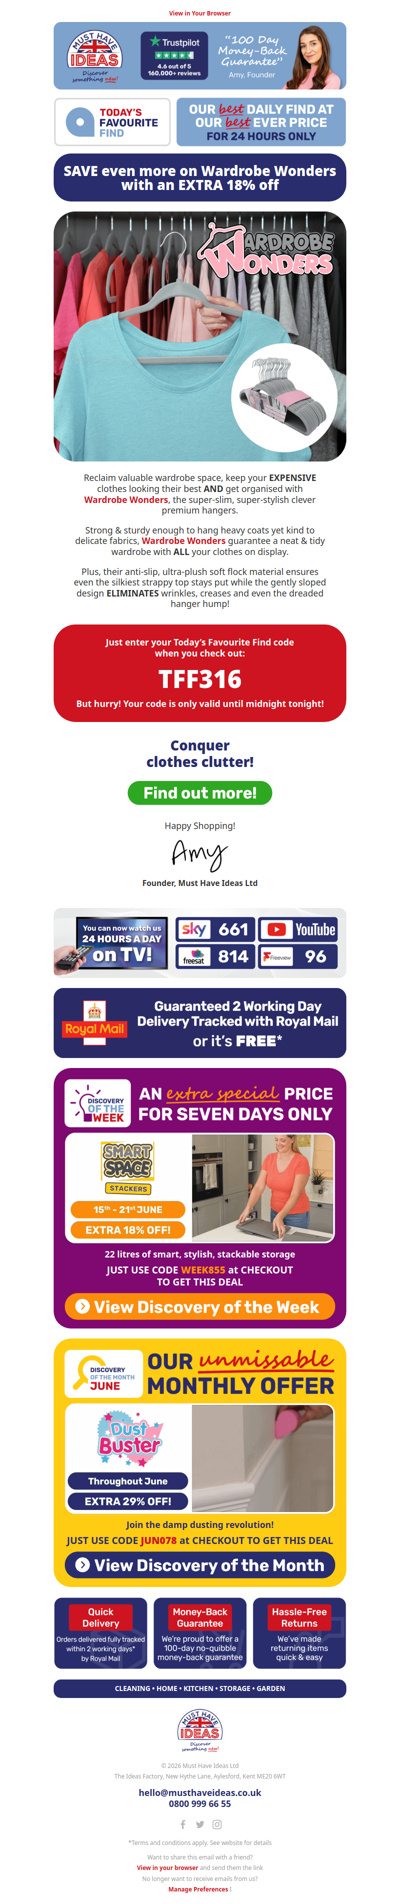
musthaveideas
GB
·
2026-6-17
Wondering how to make more space? 😫👚
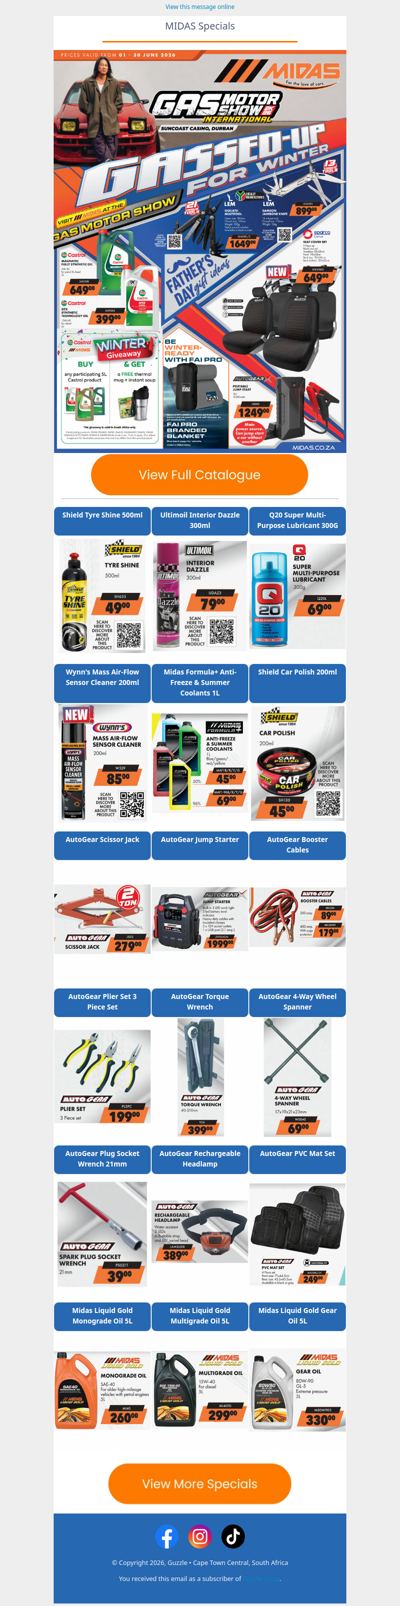
guzzle
ZA
·
2026-6-17
MIDAS : Gassed-Up For Winter
walmart
CA
·
2026-6-16
Say YES to savings! 💰
bolivia-divina
AR
·
2026-6-17
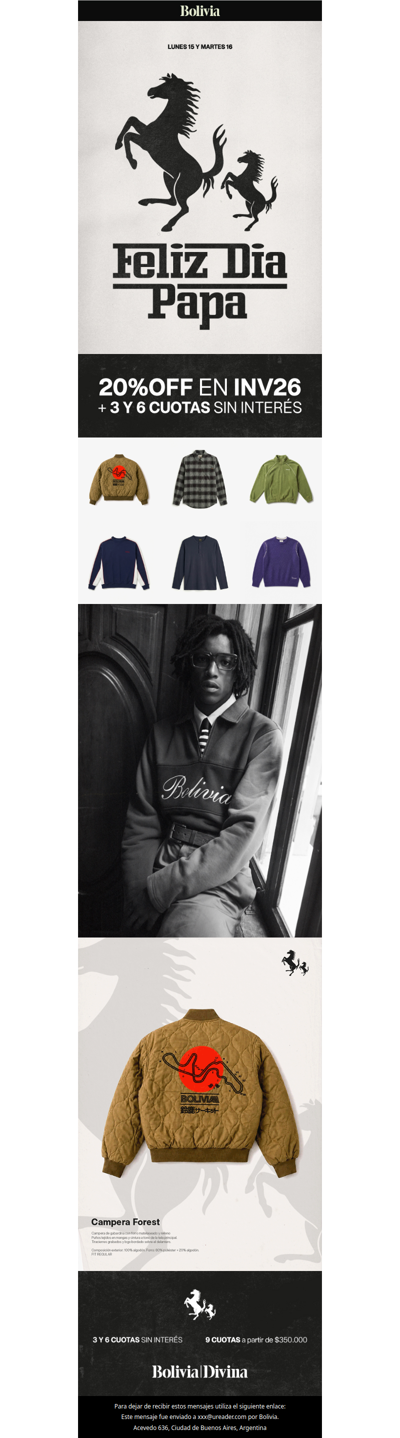
Elegí el regalo para papá y llevate un 20% OFF 🎁
bellababy
IE
·
2026-6-17
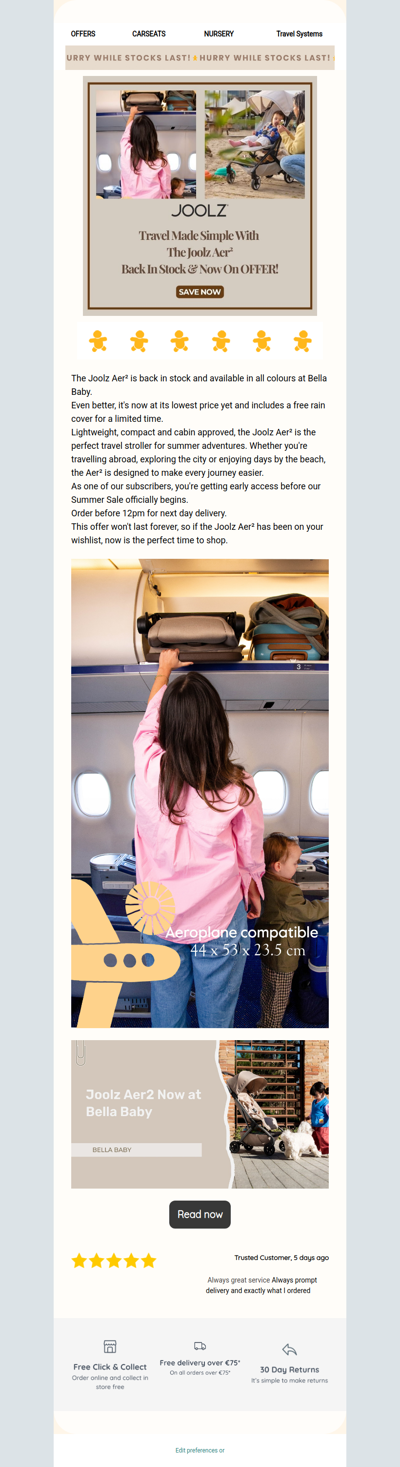
Subscriber Early Access: Joolz Aer² Is Back in stock & on offer
tiplino
HU
·
2026-6-17
A hét ajánlatai: akár -60 % 💥
1
2
3
4
5
©2024 UReader
Home
Brands
Marked Emails
Followed Brands
Privacy Policy & User Agreement