Newsletter Search Engine
Total 313759 mails


dvdland
AU
·
2026-6-10
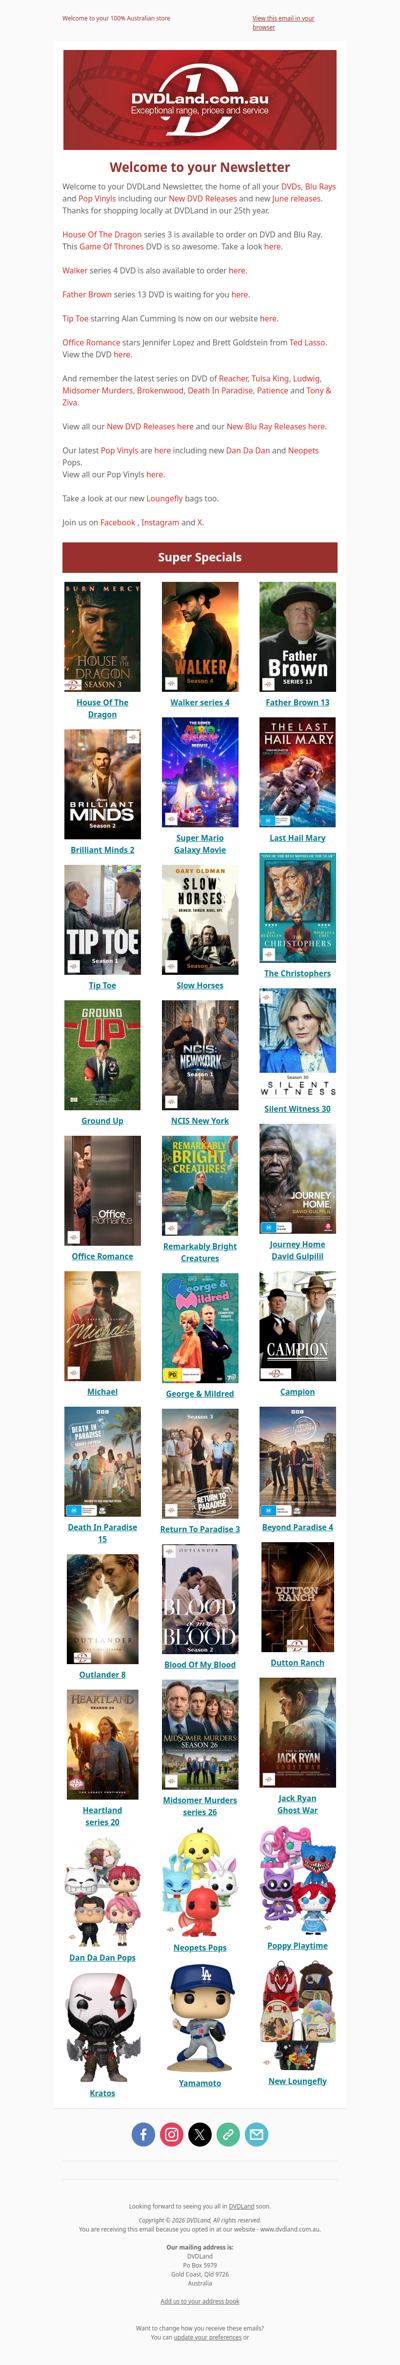
DVDLand Newsletter - House Of The Dragon 3, Father Brown 13, Walker 4, Slow Horses 6 🐉
Newsletter Search Engine