Newsletter Search Engine
Total 317848 mails


wikideals
ZA
·
2026-6-22
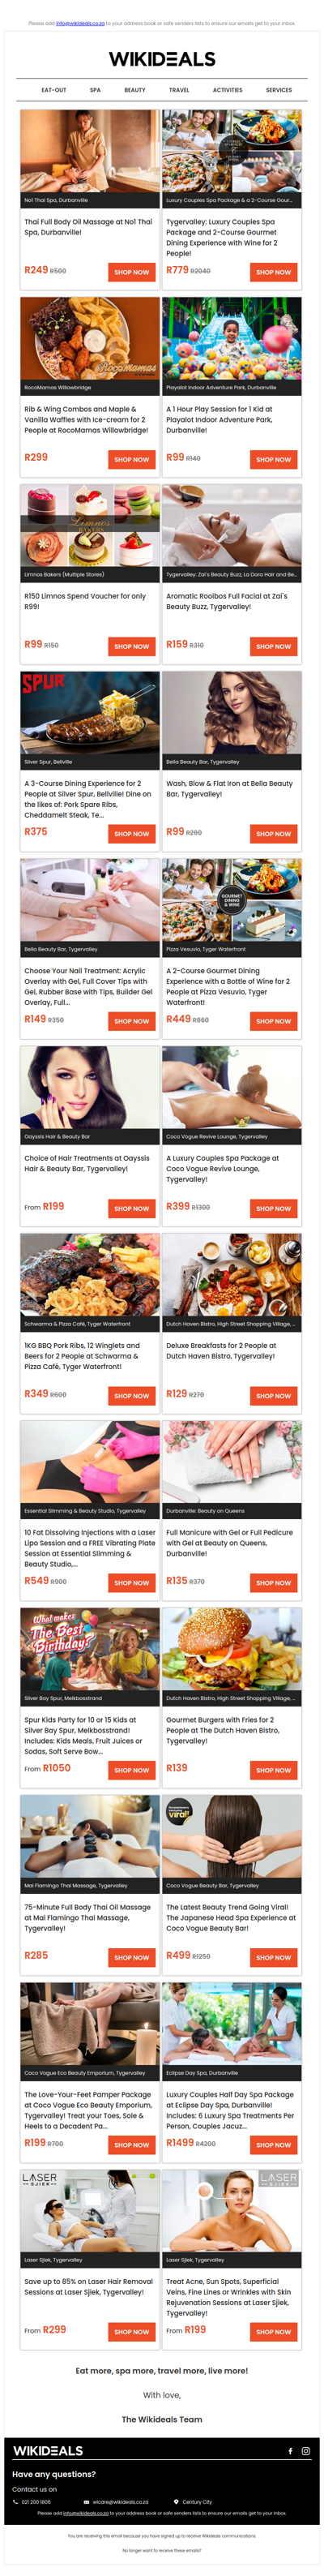
Durbanville: Thai Full Body Massage at No1 Thai | Tygervalley: Luxury Couples Spa Package & a 2-Course Gourmet Dining Experience