Newsletter Search Engine
Total 316760 mails
jollyroom
SE
·
2026-6-19
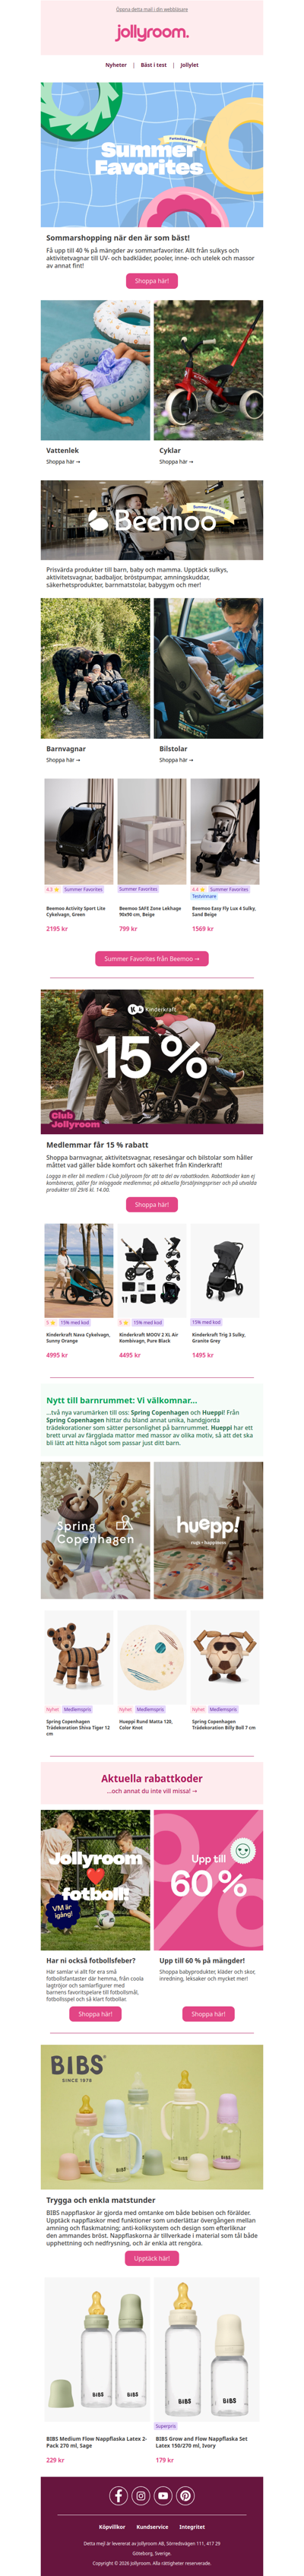
🌺Upp till 40 % på summer faves från Cybex, Bestway, Bluey, Disney, Alice & Fox, Baby’s Only & många fler

sears
GLOBAL
·
2026-6-19

🎆 Ready, set, shop! Early 4th of July fun starts now! 🎇 Grab an extra 10% off tools and more before the fireworks! 💥