Newsletter Search Engine
Total 317758 mails


kogan
GLOBAL
·
2026-6-22
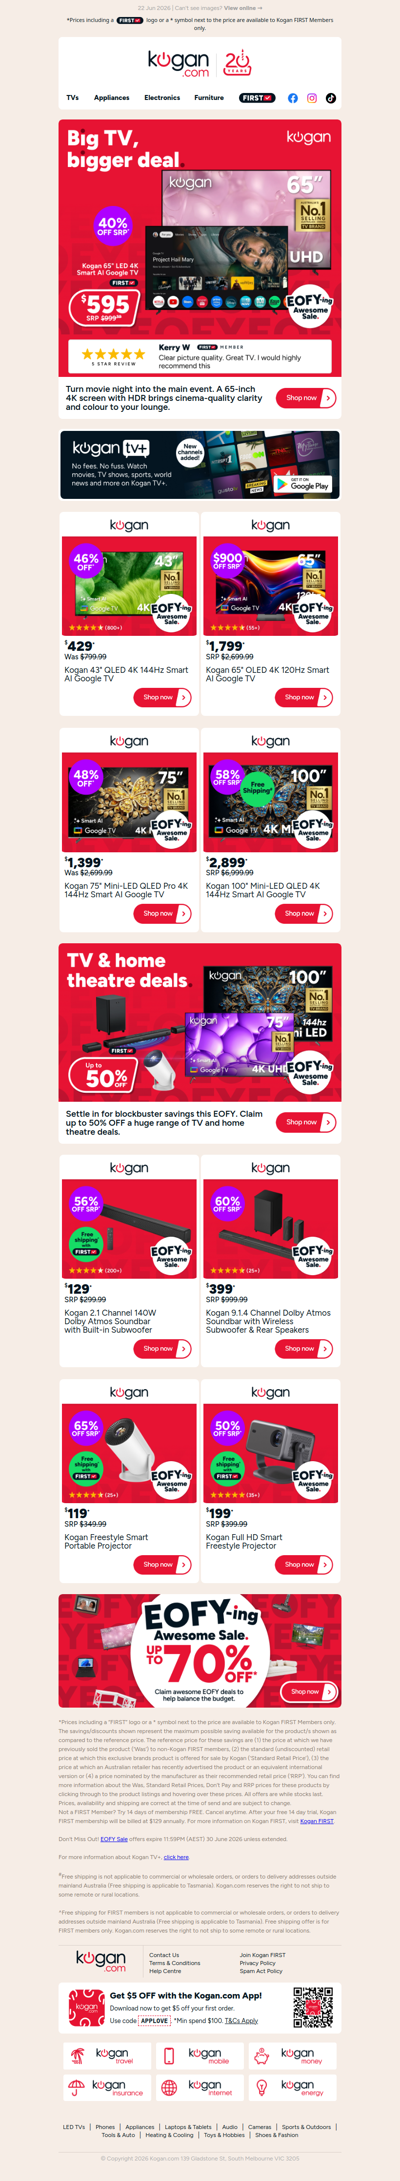
EOFY TV Deal 📺 65" 4K Smart AI Google TV NOW $595 (40% OFF standard retail price)
Newsletter Search Engine