Newsletter Search Engine
Total 318020 mails


ihotoffers
GLOBAL
·
2026-6-23
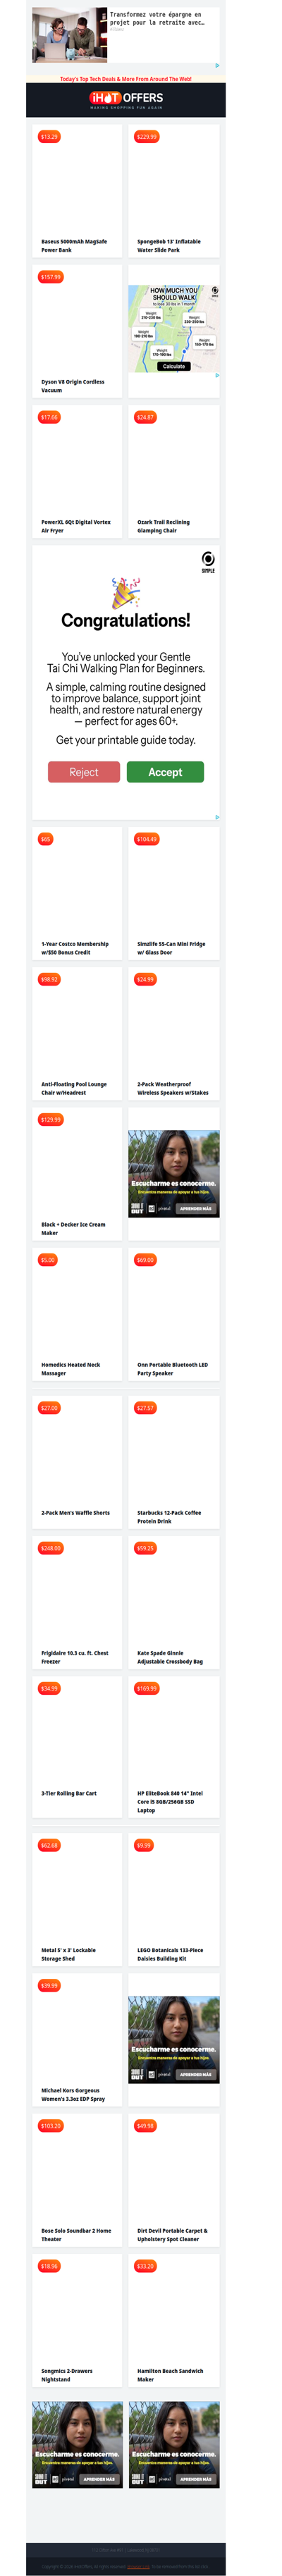
MagSafe Power Bank $13 • SpongeBob Water Park $229 • XL Air Fryer $17 • Dyson V8 Vac $157 • Glamping Chair $24 • Costco Membership $15* • Glass Fridge $104
![【内含最高 50,000 日元优惠券】入手高端大牌单品,让日常更具高级感!👜 [FJ]](https://api.ureader.com/mail/thumbnail/fromjapan.co.jp/1782151318661/内含最高-50-000-日元优惠券-入手高端大牌单品-让日常更具高级感-fj.webp)