Newsletter Search Engine
Total 317438 mails

ponudadana
HR
·
2026-6-21
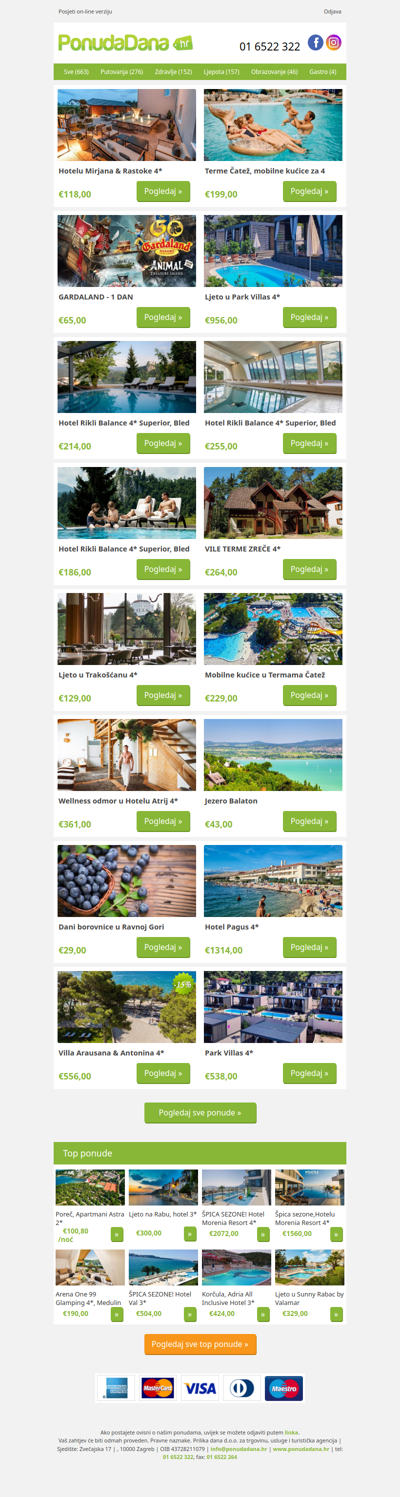
✔ Hotelu Mirjana Rastoke 4 | Terme Čatež, mobilne kućice za 4 | GARDALAND - 1 DAN | Ljeto u Park Villas 4 | Hotel Rikli Balance 4 Superior, Bled | Hotel Rikli Balance 4 Superior, Bled | Hotel Rikli Balance 4 Superior, Bled