Newsletter Search Engine
Total 317506 mails

![⏰限时24小时!即刻可用超值优惠券发放中|JDirectItems Auction [FJ]](https://api.ureader.com/mail/thumbnail/fromjapan.co.jp/1782007302219/限时24小时-即刻可用超值优惠券发放中-jdirectitems-auction-fj.webp)
hobbybox
FI
·
2026-6-21
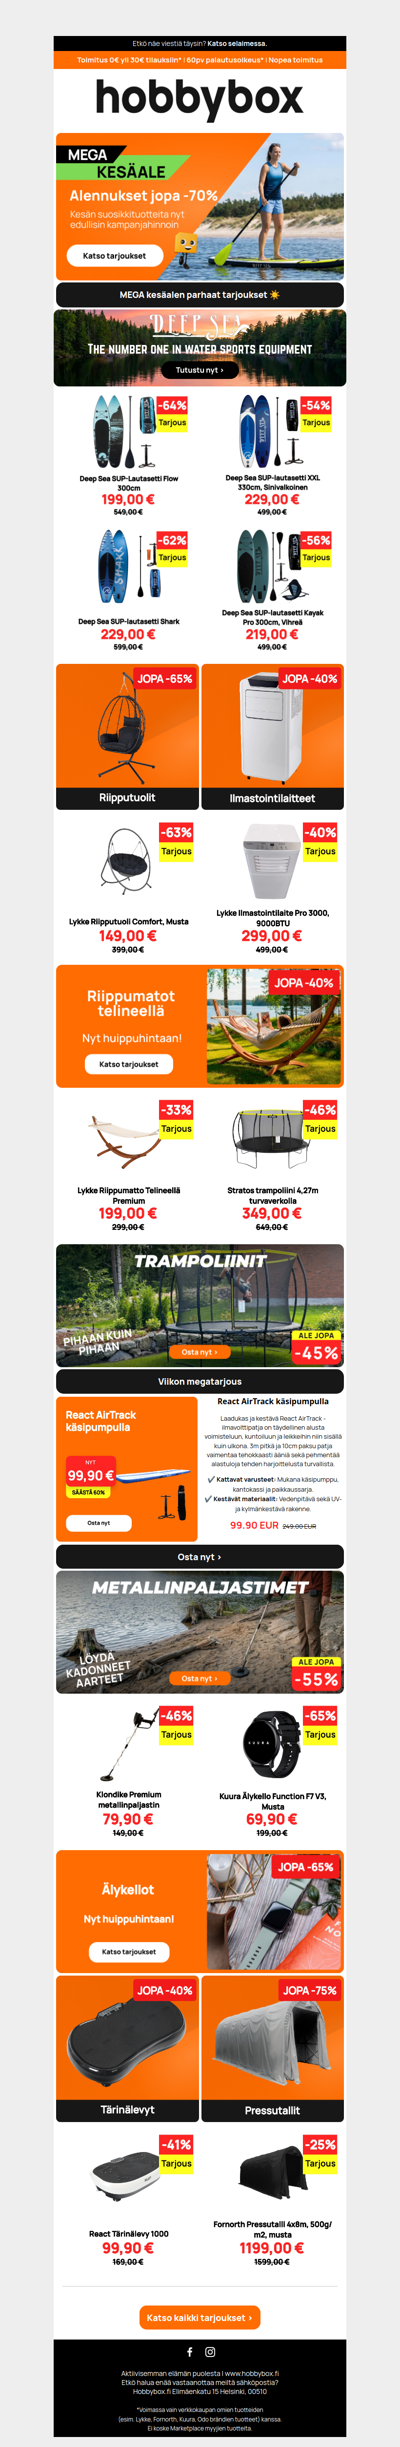
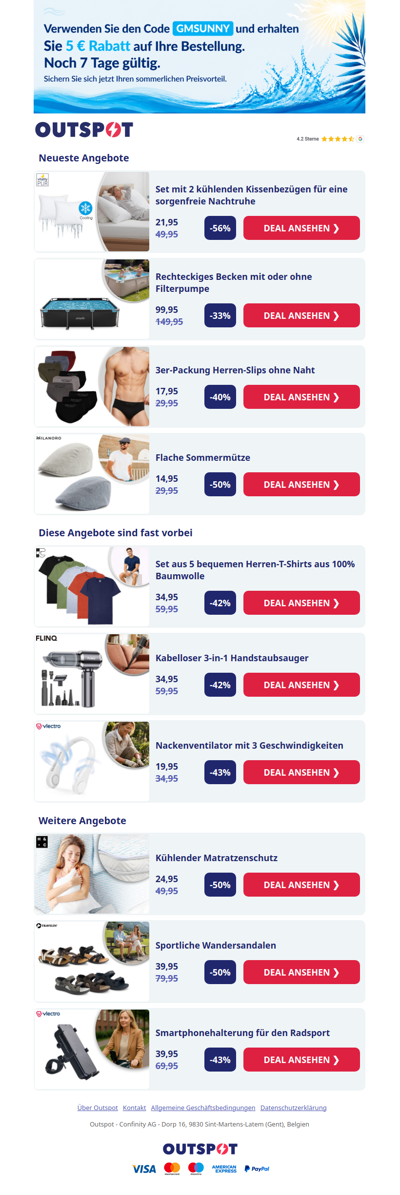
🌞 Ota kaikki irti kesäpäivistä – tässä viikon parhaat varusteet vapaa-aikaan!
Newsletter Search Engine