Newsletter Search Engine
Total 317703 mails
ha
GLOBAL
·
2026-6-22
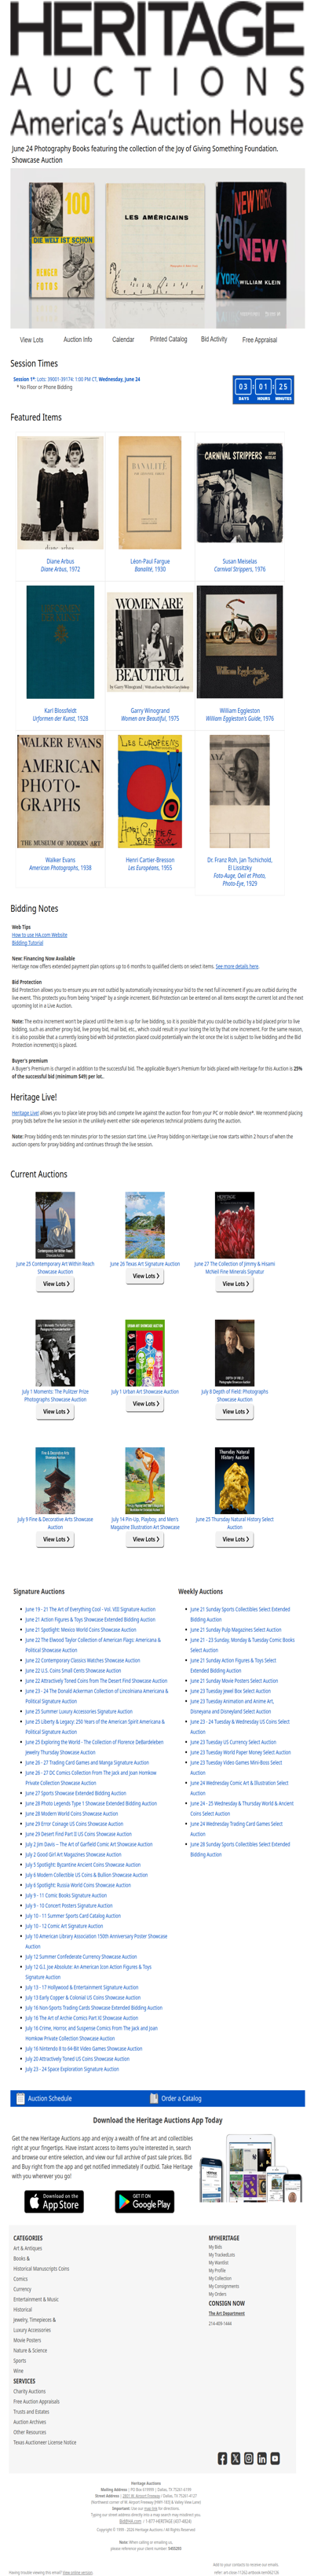
Ending Soon: June 24 Photography Books featuring the collection of the Joy of Giving Something Foundation. Showcase Auction

costco
MX
·
2026-6-22
$3,000 de Descuento al Comprar una Barra de Sonido y una Pantalla Participante