UReader
Brands
Sign in
Sign up
Newsletter Search Engine
Dates
2025 (205704)
2026 (58135)
2024 (51094)
Business Categories
General
(100138)
Other
(57260)
Home
(21944)
Fashion
(20978)
Electronics
(16611)
Literature
(11206)
Sports
(11089)
Art
(8519)
Machinery
(5007)
Health
(4657)
Food
(2914)
Country
GLOBAL
(36292)
CO
(19581)
NL
(17220)
AU
(16781)
GB
(14861)
NZ
(14811)
US
(13550)
BE
(13158)
DE
(8909)
FI
(8581)
CL
(7664)
CA
(7453)
PL
(7311)
RO
(7141)
ES
(6750)
HU
(6501)
ZA
(6434)
AR
(5972)
IL
(5956)
DK
(5637)
FR
(5298)
SK
(5224)
BR
(5166)
HR
(5075)
IT
(4981)
CZ
(4654)
PT
(4491)
SE
(4469)
IE
(3847)
GR
(3820)
NO
(3784)
SG
(3142)
CH
(3051)
BG
(2918)
RU
(2615)
MY
(2283)
UA
(2258)
MX
(2160)
AT
(2126)
JP
(2120)
PE
(1848)
RS
(1768)
TR
(756)
VE
(752)
IO
(669)
ID
(590)
TW
(588)
PK
(576)
IQ
(542)
HK
(499)
MA
(476)
PH
(438)
TV
(409)
AE
(316)
TH
(250)
KW
(188)
KP
(108)
VN
(54)
EG
(42)
IN
(8)
KZ
(4)
MD
(2)
NU
(2)
LT
(1)
BA
(1)
LK
(1)
Total 314933 mails
baby-markt
AT
·
2026-6-13
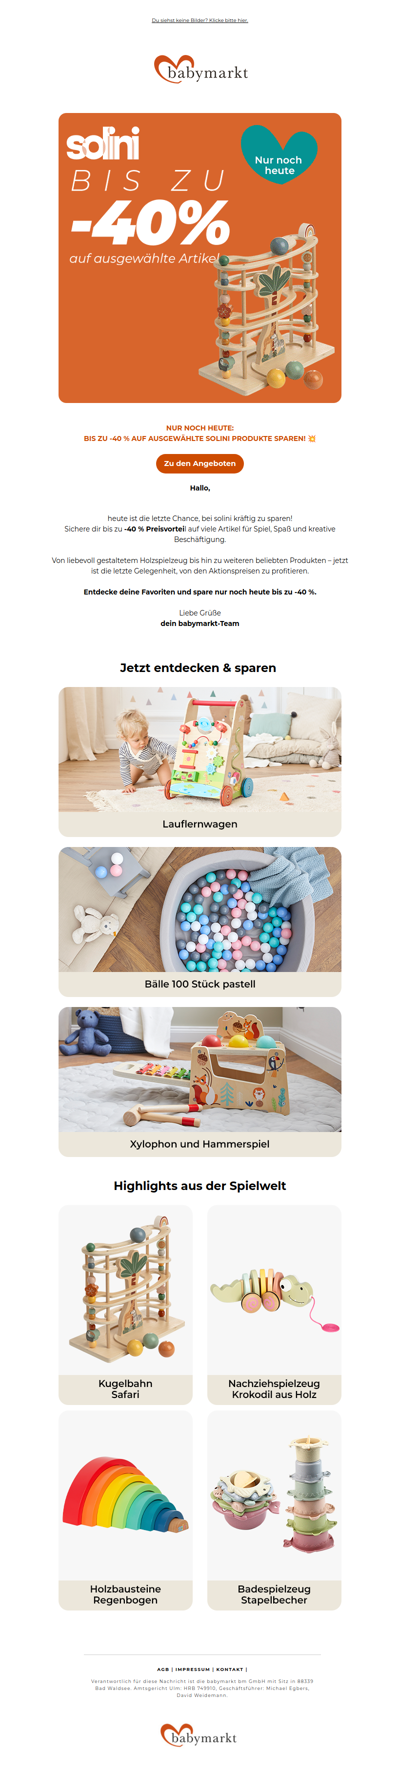
Spielzeug-Highlights: Bis zu -40 % auf solini – nur noch heute!
fiksuruoka
FI
·
2026-6-13
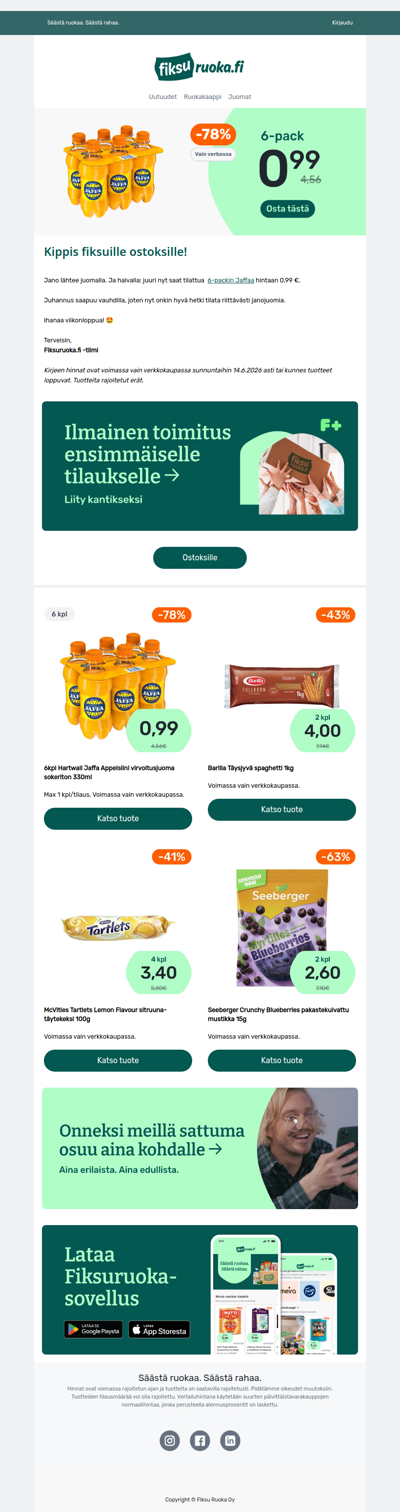
Jaffa 6-pack 0,99 € 😎
phonelook
CH
·
2026-6-13
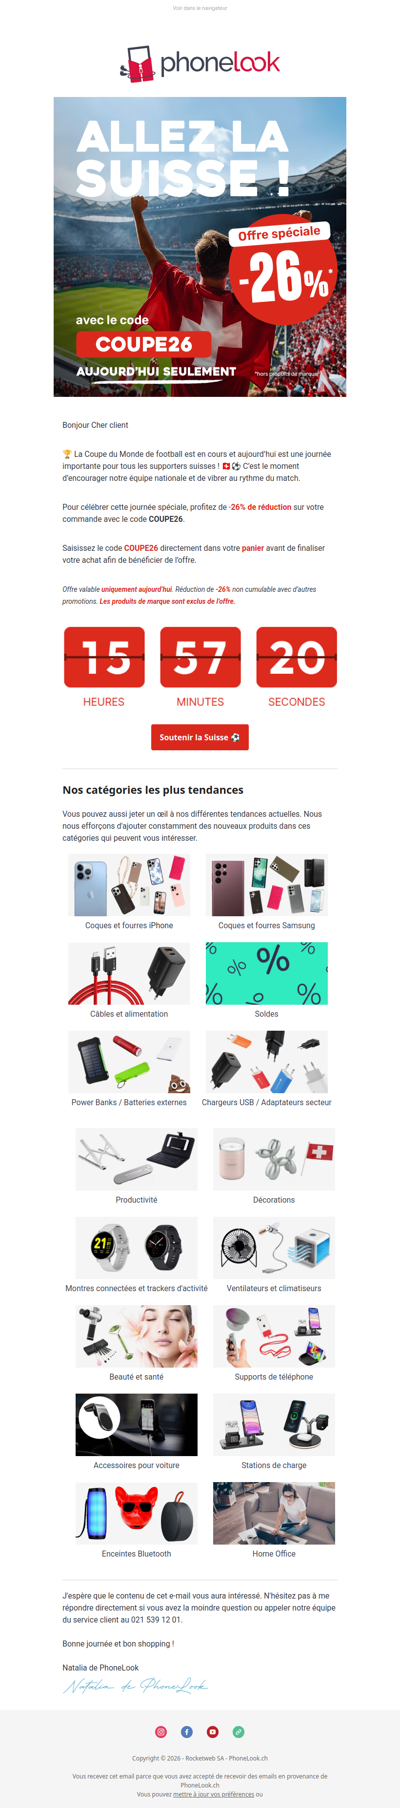
-26% pour soutenir la Suisse ! ⚽🇨🇭
guzzle
ZA
·
2026-6-13
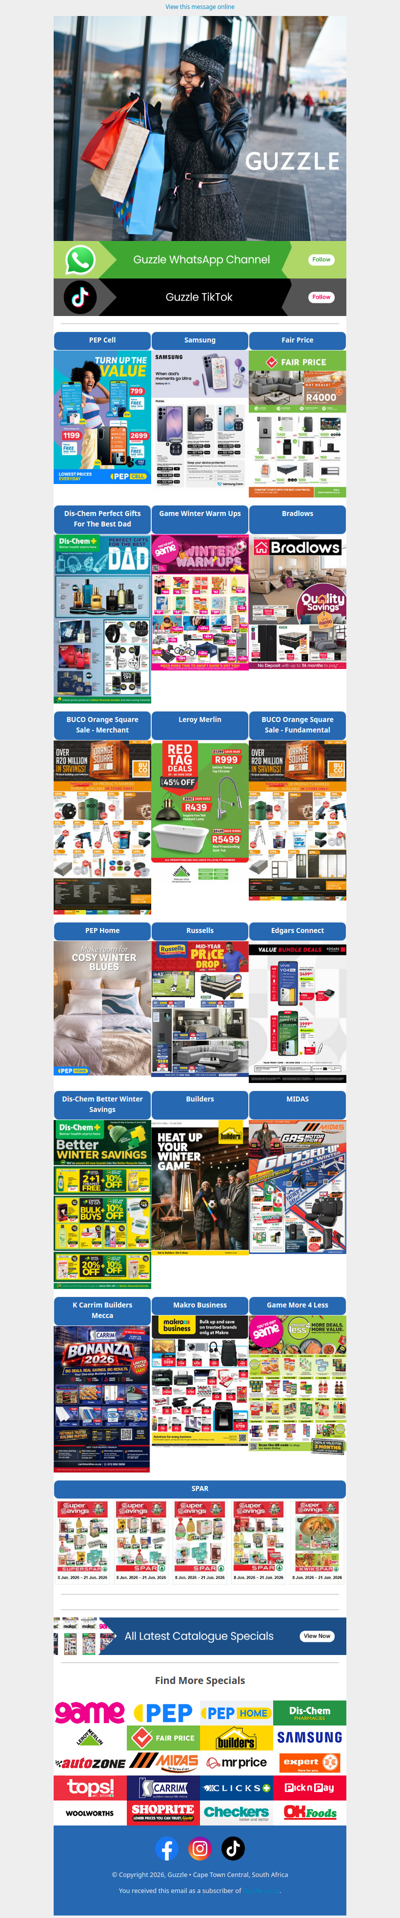
Weekend Savings
samsonite
ES
·
2026-6-13
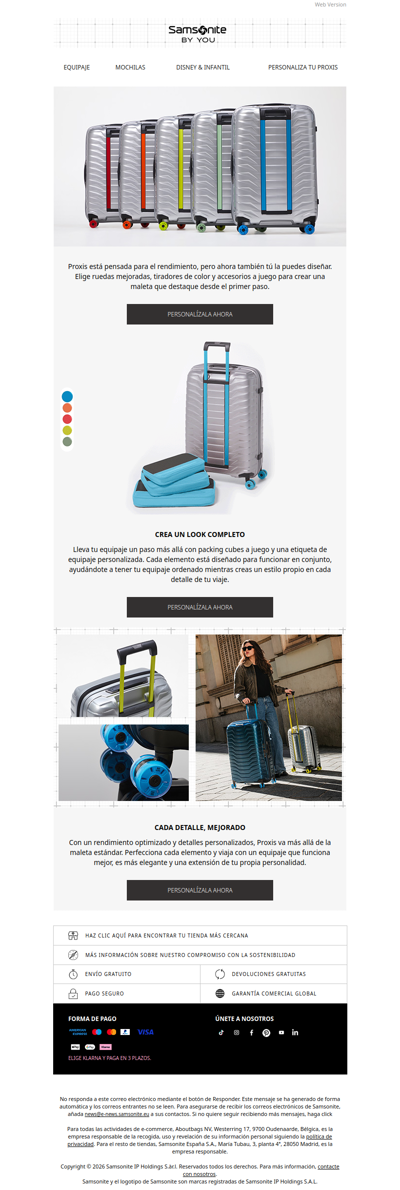
Proxis, diseñada por ti
jollyroom
SE
·
2026-6-13
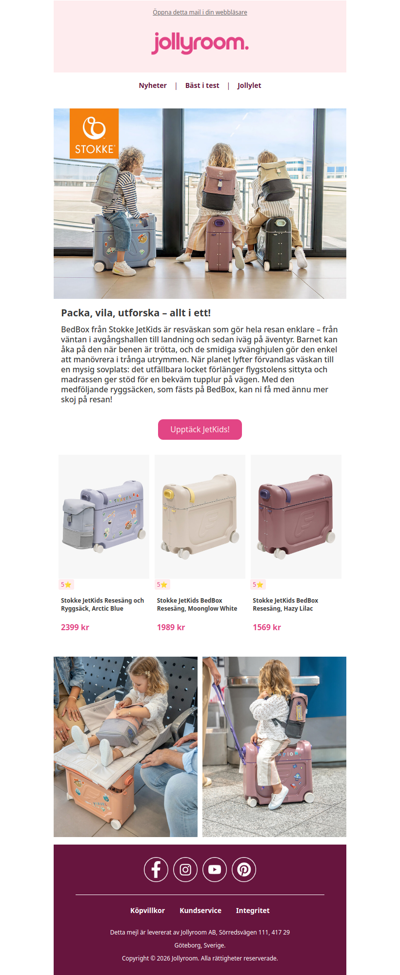
Stokke JetKids BedBox gör flygresan till ett äventyr ✈️
hemtex
FI
·
2026-6-13
🌼 Kesäale: -50%* ostaessasi vähintään kaksi tuotetta
temax
BG
·
2026-6-13
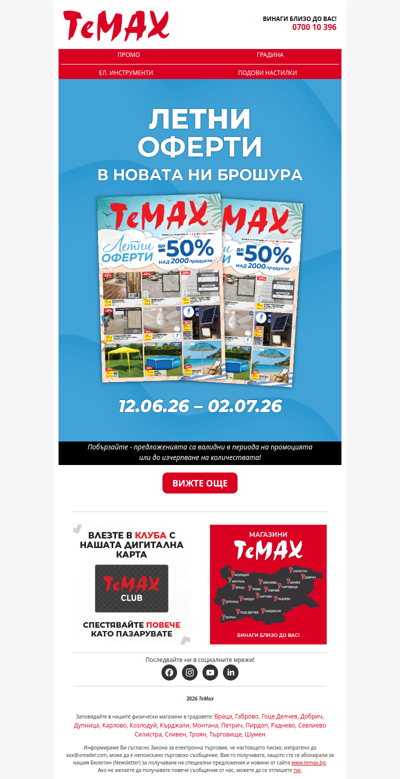
Летни оферти с до -50% в новата брошура на ТеМах! Вижте сега!🤩
startfitness
GB
·
2026-6-13
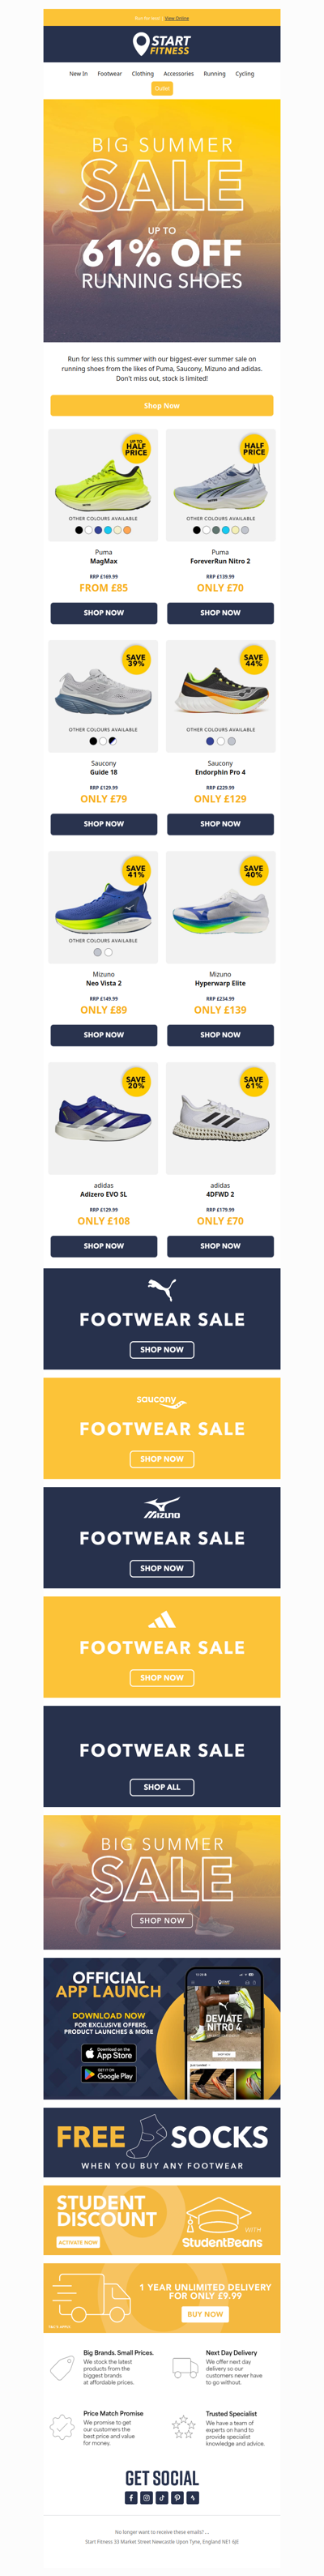
Price drop ⬇️ summer shoe sale
jollyroom
NO
·
2026-6-13
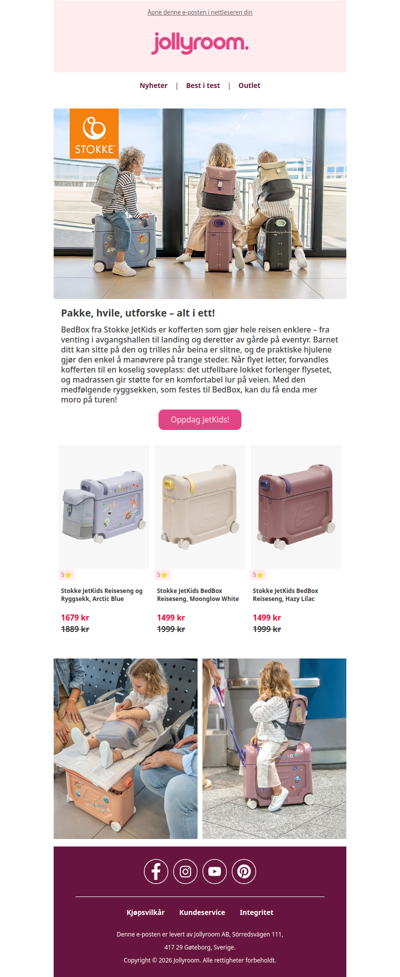
Stokke JetKids BedBox gjør flyreisene til et eventyr✈️
seetickets
GLOBAL
·
2026-6-13
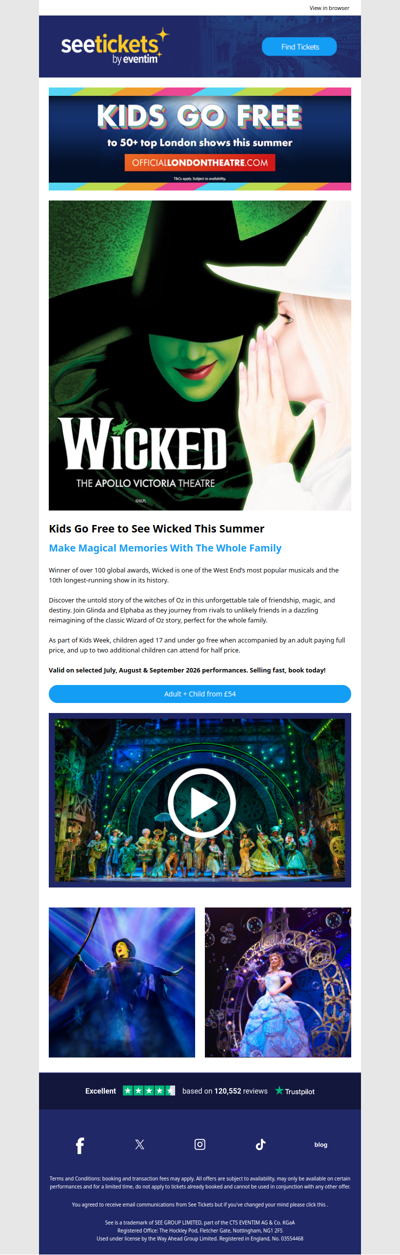
Kids Go Free to See Wicked This Summer 🎉
yarnspirations
GLOBAL
·
2026-6-13
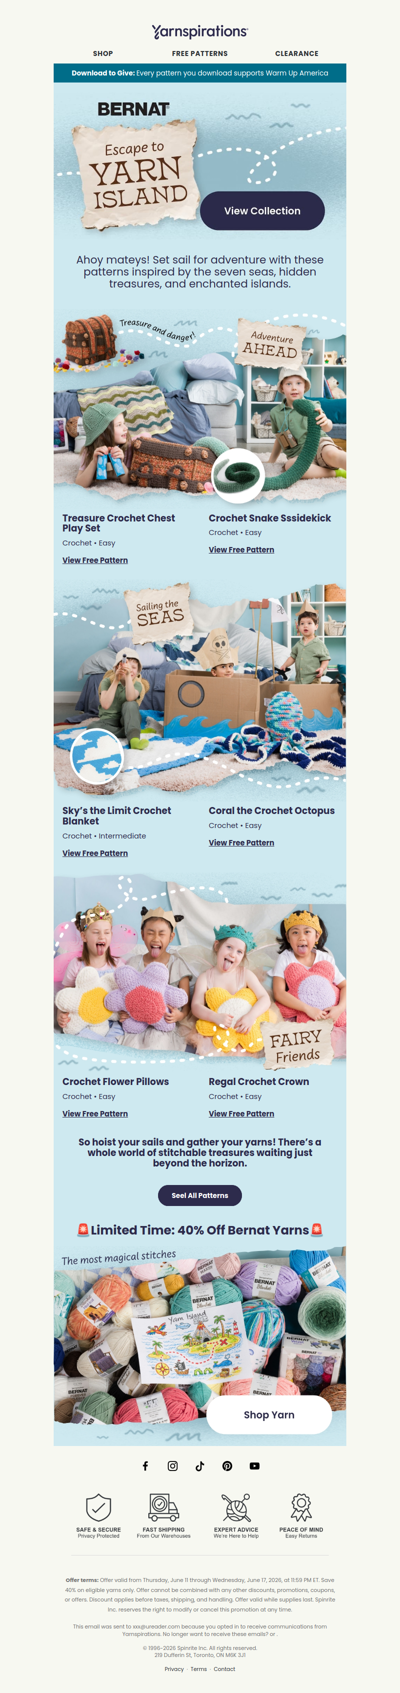
The Ocean Called. It Left You Free Patterns 🌊
1
2
3
4
5
©2024 UReader
Home
Brands
Marked Emails
Followed Brands
Privacy Policy & User Agreement